
Image
|
Figure Caption
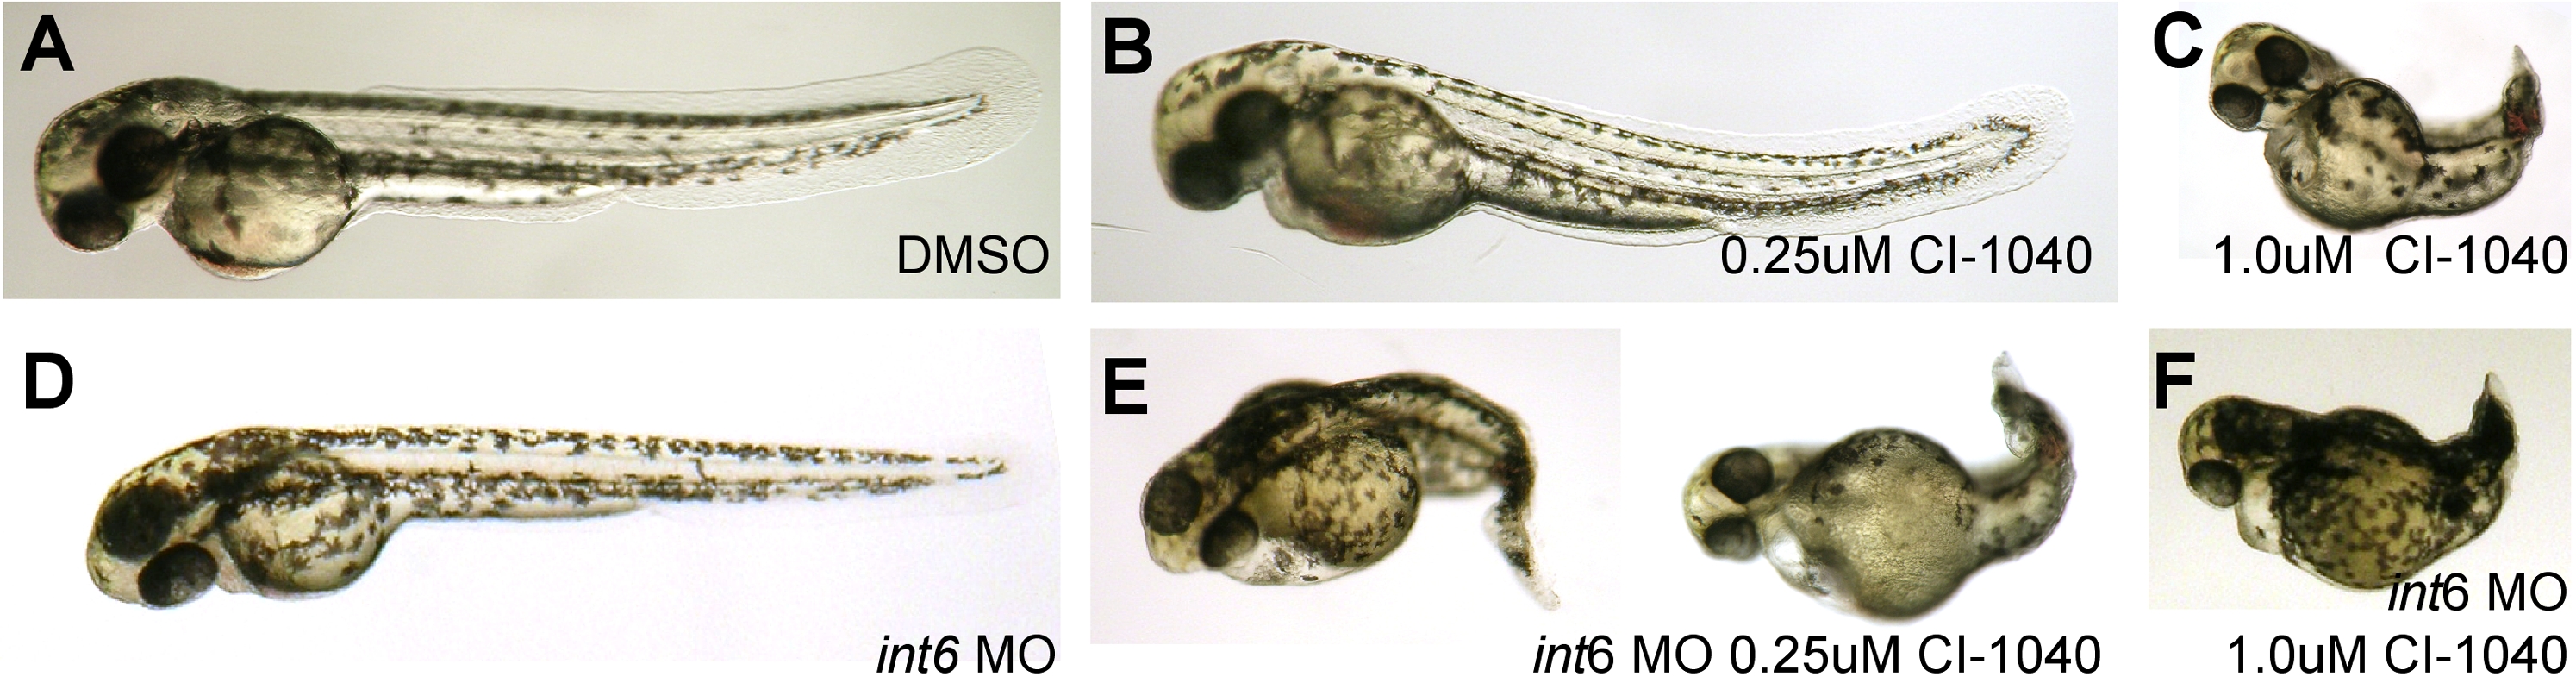
Fig. 4 Int6 and Mek signaling interact in vivo. (A–C). Only embryos treated with the 1.0 μM CI-1040, and not 0.25 μM, show a loss of posterior structures, in contrast to (D) int6 morphants (int6 MO 0.25 ng). (E, F) In combination with 0.25 μM of CI-1040, 0.25 μg of int6 MO causes a dramatic alteration of the anterior-posterior axis.
Acknowledgments
This image is the copyrighted work of the attributed author or publisher, and
ZFIN has permission only to display this image to its users.
Additional permissions should be obtained from the applicable author or publisher of the image.
Full text @ PLoS One