
IMAGE
Fig. S3
- ID
- ZDB-IMAGE-071002-2
- Genes
- Publication
- Zecchin et al., 2007 - Distinct delta and jagged genes control sequential segregation of pancreatic cell types from precursor pools in zebrafish
- All Figures
- Figures for Zecchin et al., 2007
Image
|
Figure Caption
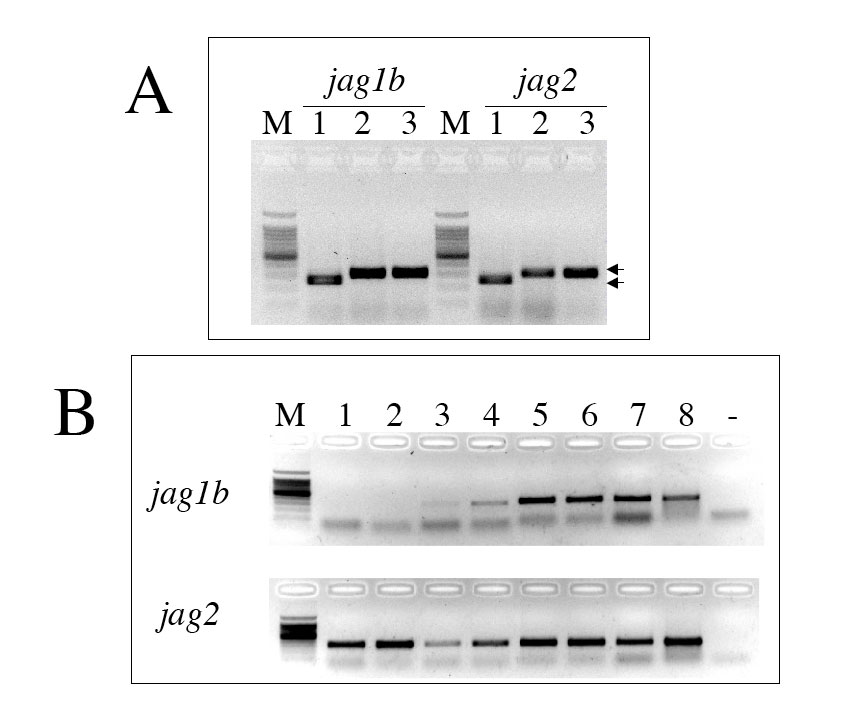
Fig. S3 RT-PCR on Jagged mRNAs. A; RT-PCR on embryos injected with jag1spliMO and jag2spliMO and controls. M = molecular weight marker, 1 = embryos injected with splicing-morpholino, 2 = embryos injected with mismatched morpholino, 3 = non-injected controls. B; RT-PCR of jagged genes on embryos at different stages of development. M = molecular weight marker, 1 = 1–2 cell stage, 2 = high stage, 3 = 50% epiboly stage, 4 = 80% epiboly stage, 5 = 5 somite stage, 6 = 16–18 hpf, 7 = 24 hpf, 8 = adult, - = negative control.
Figure Data
Acknowledgments
This image is the copyrighted work of the attributed author or publisher, and
ZFIN has permission only to display this image to its users.
Additional permissions should be obtained from the applicable author or publisher of the image.
Reprinted from Developmental Biology, 301(1), Zecchin, E., Filippi, A., Biemar, F., Tiso, N., Pauls, S., Ellertsdottir, E., Gnugge, L., Bortolussi, M., Driever, W., and Argenton, F., Distinct delta and jagged genes control sequential segregation of pancreatic cell types from precursor pools in zebrafish, 192-204, Copyright (2007) with permission from Elsevier. Full text @ Dev. Biol.