
|
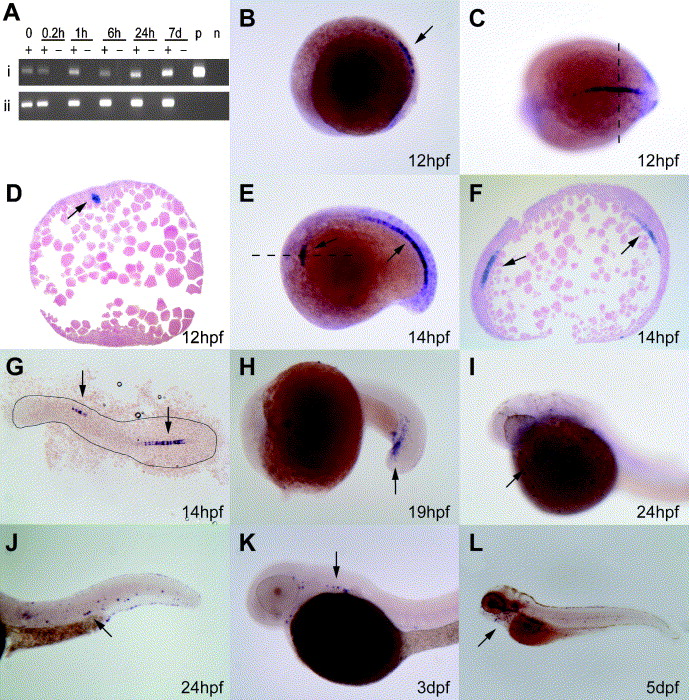
Fig. 2 Analysis of mmp9 expression during zebrafish development. (A) RT-PCR analysis. RNA was prepared from unfertilized eggs (0) or from embryos at the indicated times (hours (h) or days (d)) post fertilization with (+) or without (-) RT using primers specific for (i) mmp9 and (ii) β-actin. Controls are cloned mmp9 cDNA (positive control, p) and water (negative control, n). (B–L) Whole mount in situ hybridization. Staged zebrafish embryos were analyzed using a DIG-labeled mmp9 probe at the times indicated, with site of mmp9 expression shown with arrows. In (B, E, and H–L) embryos are orientated in a lateral view with the anterior to the left and the dorsal side up and mmp9 expression indicated with arrows. The embryo in (C) is orientated in a dorsal view with the anterior to the left. (D and F) Represent cross sections of embryos in (C and E), respectively, along the plane indicated with the dotted line in each case. (G) Represents a flat-mounted embryo with the yolk removed viewed dorsally with anterior to the left. The outline highlights the body of the embryo.
Reprinted from Gene expression patterns : GEP, 7(1-2), Yoong, S., O'connell, B., Soanes, A., Crowhurst, M.O., Lieschke, G.J., and Ward, A.C., Characterization of the zebrafish matrix metalloproteinase 9 gene and its developmental expression pattern, 39-46, Copyright (2007) with permission from Elsevier. Full text @ Gene Expr. Patterns