
|
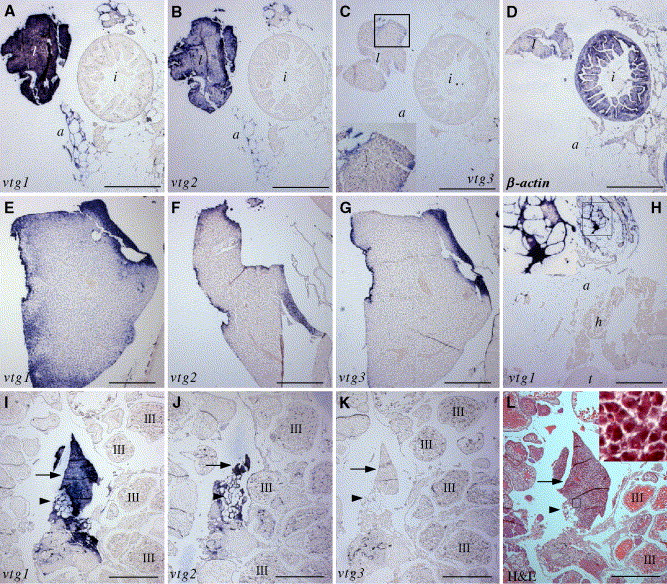
Fig. 4 Expression of vtg mRNAs in hepatocytes and extrahepatic tissues. Section in situ hybridization was carried out as described in Materials and methods and the hybridization probes used are indicated in each panel. (A–D) Sections of internal organs including the liver and intestine from control female fish, showing the expression of vtg1–2 mRNAs as purple stains in the liver and adipocytes (A and B), weak expression of vtg3 mRNA in liver (C and inset), and ubiquitous expression of β-actin mRNA (D). (E–G) Sections of liver of E2-treated male fish, showing the expression of vtg1–3 mRNAs in the surface area of liver. (H) Section of testis and surrounding tissues from E2-treated male fish, showing the expression of vtg1 mRNA in adipocyte-like cells. (I–K) Ovary sections of control female fish, showing the expression of vtg1–2 mRNAs in fully developed adipose tissue (arrowheads) and underdeveloped adipose tissue (arrows). (L) Hematoxylin and eosin staining of an adjacent section of (I–K). Some stage III oocytes are labeled with “III” in (I)–(L). Insets in (C), (H), and (L) are enlargements of boxed regions, respectively. a, adipose tissue; h, hemocytes; i, intestine, l, liver, t, testis. Scale bars = 500 μm.
Reprinted from Gene, 356, Wang, H., Tan, J.T., Emelyanov, A., Korzh, V., and Gong, Z., Hepatic and extrahepatic expression of vitellogenin genes in the zebrafish, Danio rerio, 91-100, Copyright (2005) with permission from Elsevier. Full text @ Gene