
Fig. 3
|
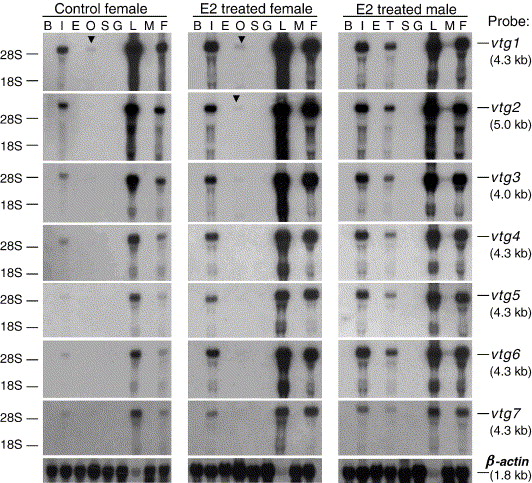
Fig. 3 Northern blot analysis of tissue distribution of vtg mRNAs in both female and male zebrafish with or without E2 treatment. Total RNAs were prepared from selected tissues as indicated at the top of each lane: B, brain; I, intestine; E, eye; O, ovary; T, testis; S, skin; G, gill; L, liver; M, muscle; F, whole fish. 10 μg of total RNA was loaded each lane. Blots were first hybridized with 32P-labeled vtg probes and stripped and reprobed with a β-actin cDNA probe to ensure even loading and integrity of RNAs. Representative blots with the β-actin probe are shown at the bottom and consistently the level of β-actin mRNA is lower in the liver than in other tissues (Wang et al., 2000 and Mudumana et al., 2004). No vtg hybridization signal was detected in any tissue in control male zebrafish (not shown). The positions of 28S and 18S ribosomal RNAs are marked on the left and names of vtg transcripts with estimated molecular weights on the right. Weak signals in ovary total RNA are marked by arrowheads.
Reprinted from Gene, 356, Wang, H., Tan, J.T., Emelyanov, A., Korzh, V., and Gong, Z., Hepatic and extrahepatic expression of vitellogenin genes in the zebrafish, Danio rerio, 91-100, Copyright (2005) with permission from Elsevier. Full text @ Gene