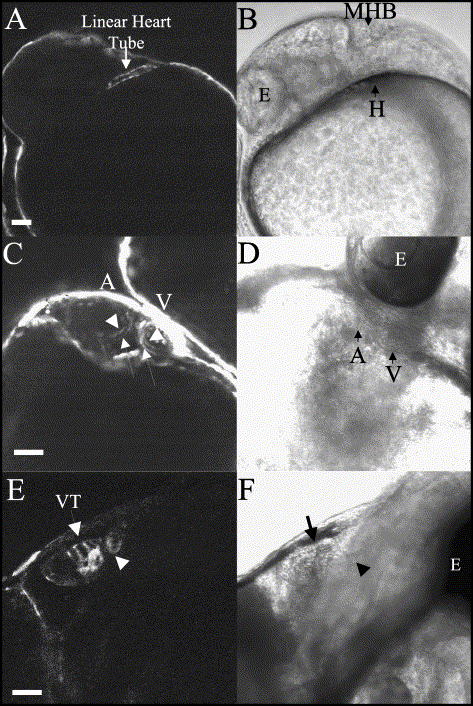
Fig. 4 Visualization of the developing heart tube using 14.8 kb of GATA-4 regulatory sequences to direct GFP expression. (A) GFP expression is seen throughout the newly fused heart tube at 24 hpf. (B) Phase of A. (C) GFP expression is seen in the endocardium (arrowheads) and the myocardium (arrows) of both the atrium and the ventricle at 48 hpf. (D) Phase of C. (E) GFP expression is present in the ventricular trabeculae (arrow) and the bulboventricular valve (arrow head) of the heart at 6 days post fertilization. (F) Phase of E. A, B, E and F are lateral views with anterior to the left. C and D are ventral views with the head up. Scale BAR = 50 μM. A = atrium, E = eye, H = heart, MHB = midbrain hindbrain border, V = ventricle and VT = ventricular trabeculae.
Reprinted from Developmental Biology, 267(2), Heicklen-Klein, A., and Evans, T., T-box binding sites are required for activity of a cardiac GATA-4 enhancer, 490-504, Copyright (2004) with permission from Elsevier. Full text @ Dev. Biol.

