
|
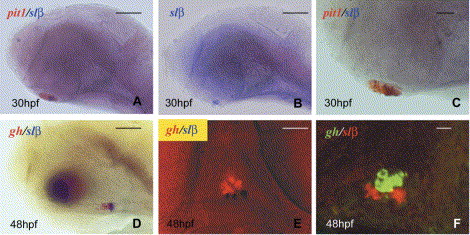
Fig. 2 Slβ expression pattern during embryogenesis. WT zebrafish embryos at 30 hpf (A–C) and 48 hpf (D–F). (A–D) Lateral view, anterior to the left. (E,F) ventral view, anterior to the top. Scale bars represent 40 μm. (A–C) Slβ is expressed in several cells also expressing pit1. The blue label corresponds to slβ, red to pit1. (B) same emryo as in (A) after the red label was washed out. (D–F) Gh and slβ are expressed in different cells. (D,E) slβ label is in blue and Gh was revealed by using Fast Red, for visualization by classical microscopy (D) and by fluorescence (E). Gh (in red) is expressed anterior to slβ (in blue) (F) The same embryos were analyzed by combined fluorescent in situ hybridization: red fluorescence for slβ and green for gh. Gh-expressing cells are clearly anterior to slβ-expressing ones.
Reprinted from Gene expression patterns : GEP, 6(2), Lopez, M., Nica, G., Motte, P., Martial, J.A., Hammerschmidt, M., and Muller, M., Expression of the somatolactin beta gene during zebrafish embryonic development, 156-161, Copyright (2006) with permission from Elsevier. Full text @ Gene Expr. Patterns