
Image
|
Figure Caption
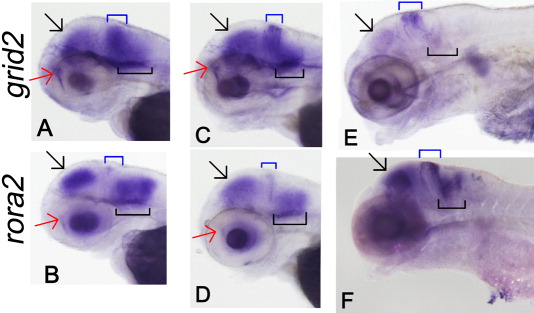
Fig. 6 Developmental expression pattern of grid2 (A,C,E) and rora2 (B,D,F) in 48 hpf (A,C), 72 hpf (B,D), and 120 hpf (E,F) specimens. Expression of both genes was observed in the telencephalon (red arrows), the optic tectum (black arrows), upper rhombic lip (the cerebellum, blue boxes), and the lower rhombic lip (black boxes) and eyes. Expression of grid2 in the cerebellum is wider than that of rora2 along the anterior-posterior axis. In C, nonspecific staining was observed in surface of the cranial cavity.
Figure Data
Acknowledgments
This image is the copyrighted work of the attributed author or publisher, and
ZFIN has permission only to display this image to its users.
Additional permissions should be obtained from the applicable author or publisher of the image.
Full text @ Dev. Dyn.