
|
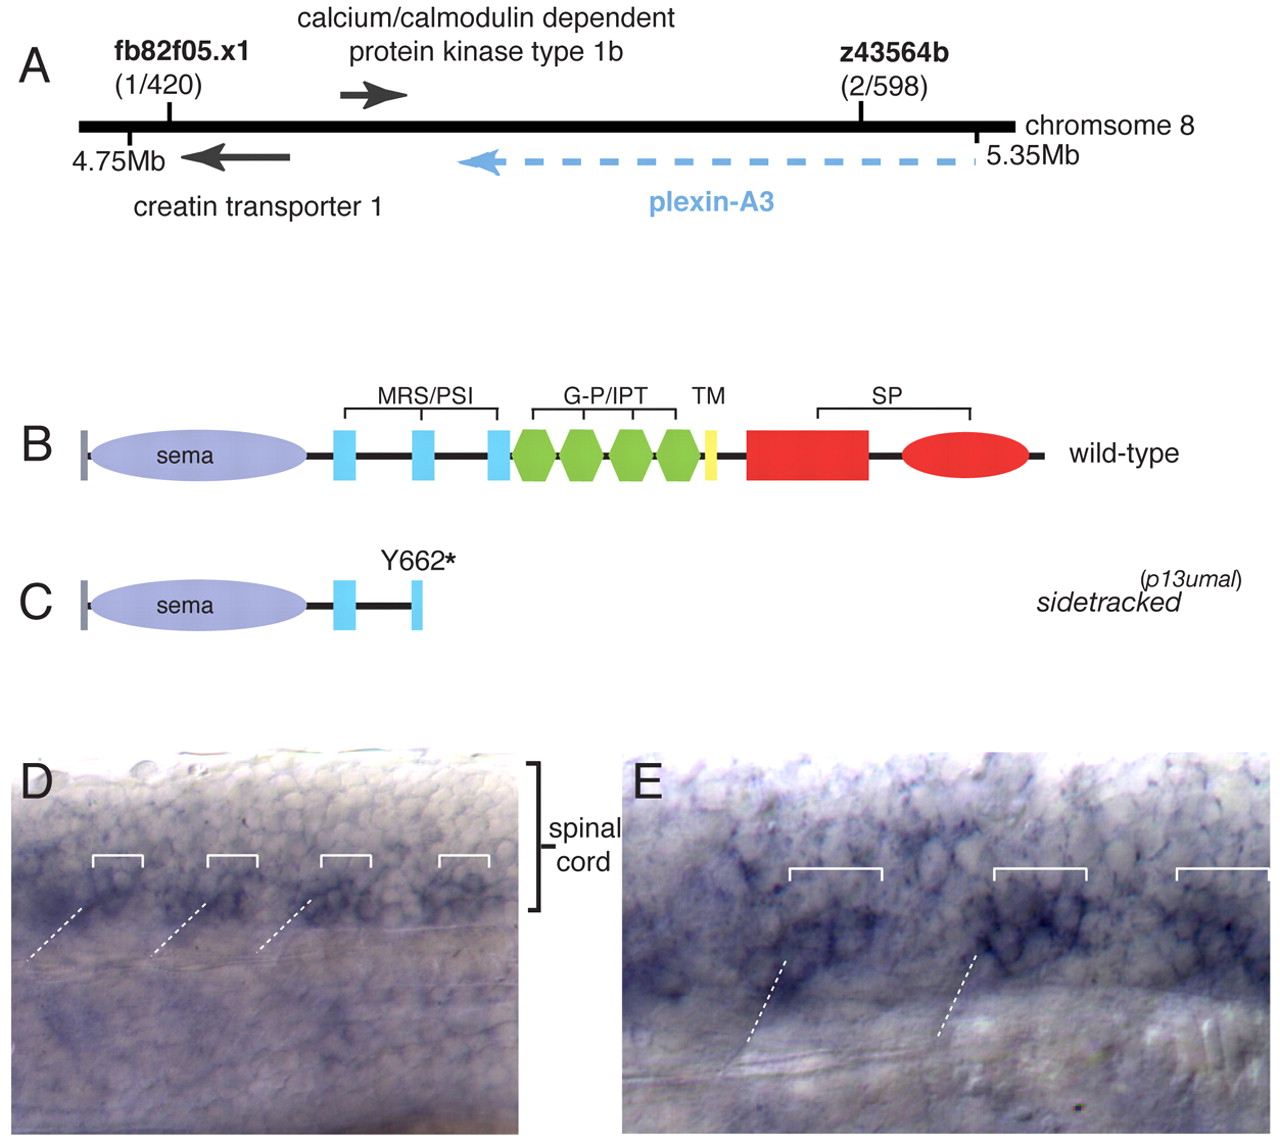
Fig. 3 Molecular cloning and plexin A3 expression. (A) Molecular genetic map of the sidetracked (plexin A3) region. (B) Domain organization of the wild-type Plexin A3 protein. (C) The sidetrackedp13umal allele is a presumptive null. For domains, see main text. (D) Lateral view of a wild-type embryo processed for plexin A3 in situ hybridization. Low-level expression is detectable throughout the spinal cord and appears enriched in neurons close to the somite boundary. (E) High-magnification view. Expression of plexin A3 is enriched in two somata adjacent to the somite boundary, consistent with the positions of middle primary (MiP) and rostral primary (RoP). Square brackets indicate motoneuron cell bodies; broken lines indicate the position of somite boundaries. G-P/IPT, glycine-proline-rich/immunoglobulin-like fold shared by plexins; MRS/PSI, Met-related sequence/plexin-semaphorin-integrin domain; SP, Sex-Plexin; TM, transmembrane.