
|
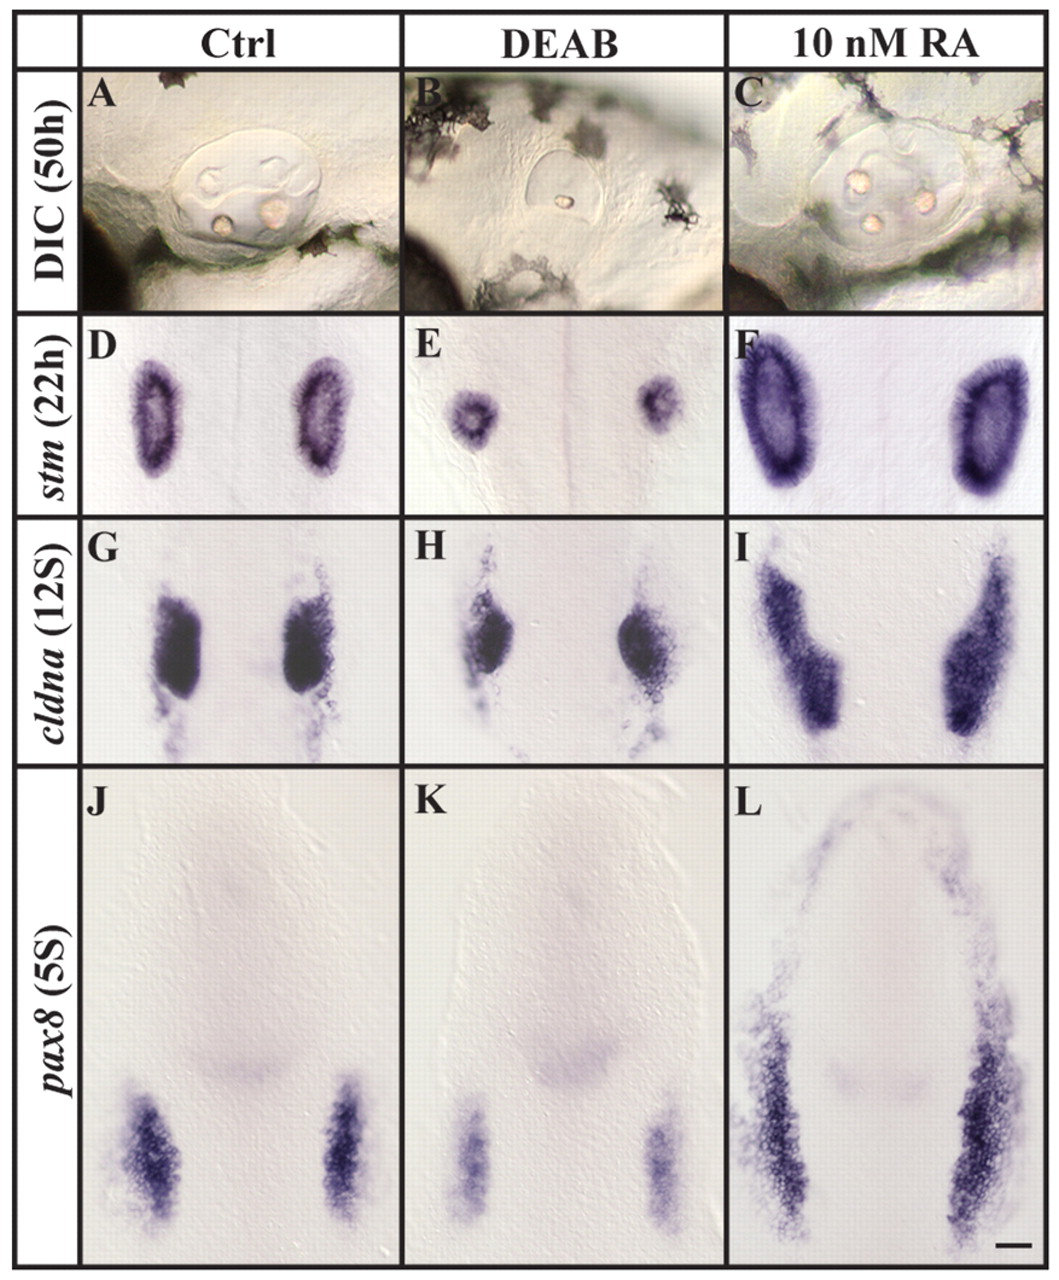
Fig. 1 Loss and excess of RA signaling generate opposite phenotypes. (A-F) Compared to control embryos, otic vesicles are reduced or increased in size, respectively, after depletion of RA signaling (DEAB) or after the application of 10 nM RA, as assessed both by morphology at 50 hpf (A-C) or stm expression at 22 hpf (D-F). (G-L) Reduction or increase in the number of preotic cells is already evident at placodal (G-I, 12-somite stage) and preplacodal (J-L, 5-somite stage) stages after labeling with cldna (G-I) or pax8 (J-L). (A-C) Lateral views of live otic vesicles with anterior to the left and dorsal towards the top. (D-L) Dorsal views with anterior towards the top. Scale bar: 35 µm.