
|
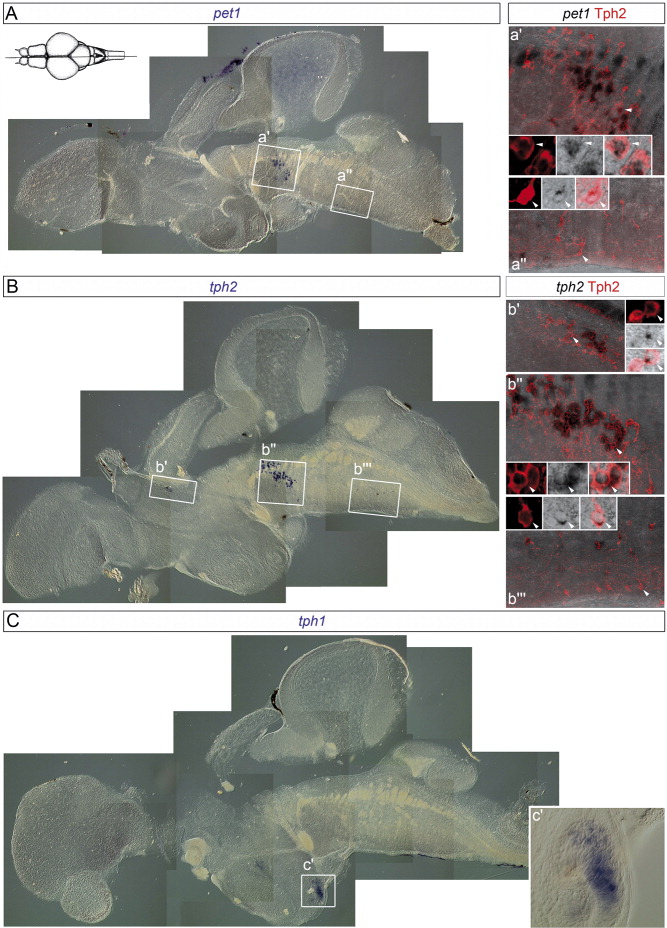
Fig. 3 Comparison of the localization of pet1, tph2, and tph1 transcripts (in situ hybridization, blue/black) and of Tph2 protein (immunohistochemistry, red) on adult brain sagittal sections. A: In situ staining for pet1 in anterior (a′) and posterior (a″) raphe nuclei. a′ and a″ (optical projections) show higher magnification of boxed areas in A together with Tph2 immunostaining in red. Note the double-labeled cells, some of which (arrowheads) are further magnified in the small insets (optical sections). B: In situ staining for tph2 in anterior (b″) and posterior (b″′) raphe nuclei and in the pretectal complex (b′). b′, b″, and b″′ (optical projections) show higher magnification of boxed areas in B together with Tph2 immunostaining. Double labeling was observed in all three regions for all cells, some of which (arrowheads) are further magnified in the small insets (optical sections). C: In situ staining for tph1 in the hypothalamus. c′ shows higher magnification of boxed area in C. Schematic picture was modified from Wullimann et al. ([1996]).