
Image
|
Figure Caption
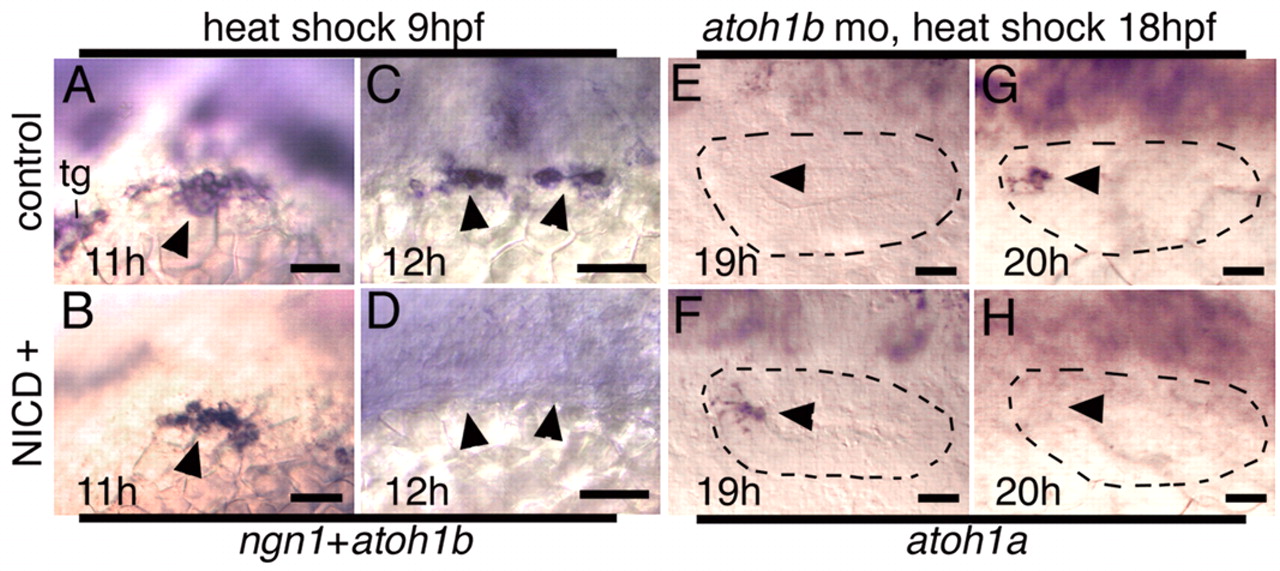
Fig. 6 Heat-shock induction of NICD. (A-D) Expression of atoh1b and ngn1 at 11 hpf (A,B) and 12 hpf (C,D) in control embryos (A,C) or NICD-positive embryos (B,D) heat shocked at 9 hpf. Loss of ngn1 expression, which is non-overlapping with atoh1b, confirms effective NICD-induction. (E-H) Expression of atoh1a at 19 hpf (E,F) and 20 hpf (G,H) in atoh1b morphants without NICD (E,G) or with NICD (F,H) heat shocked at 18 hpf. Otic vesicles are outlined. Arrowheads mark otic expression domains. All are lateral views with anterior to the left. Scale bar: 15 μm. tg, trigeminal ganglion.
Figure Data
Acknowledgments
This image is the copyrighted work of the attributed author or publisher, and
ZFIN has permission only to display this image to its users.
Additional permissions should be obtained from the applicable author or publisher of the image.
Full text @ Development