
|
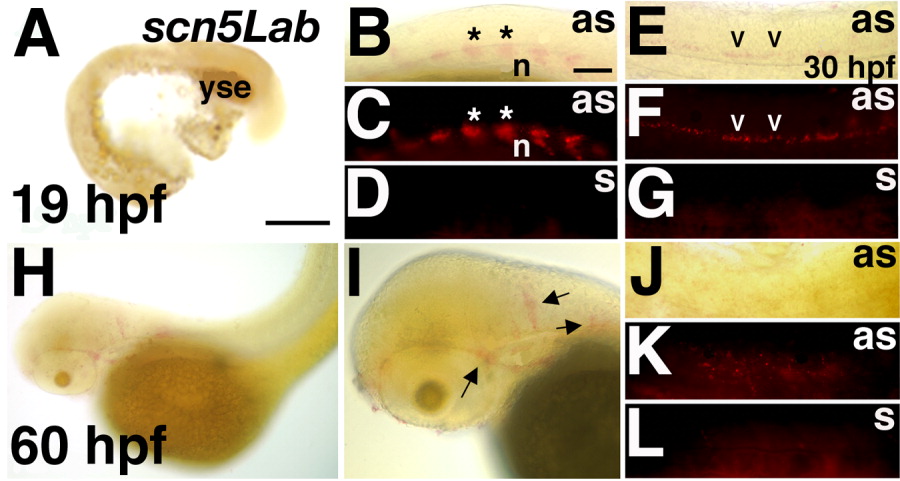
Fig. 7 In situ hybridization reveals a temporally dynamic scn5Lab expression pattern. A-D: At 19 hours postfertilization (hpf), scn5Lab mRNA is detected in the developing somites of the trunk (asterisks in B,C). The in situ hybridization signal can be observed using either brightfield (B) or epifluorescent illumination (C). E: Under the same conditions, the sense probe does not reveal a signal. E-G: At 30 hpf, scn5Lab expression shifts from the peripheral somites to the central nervous system and is detected in ventral spinal cord (carats; E,F). G: The sense probe does not reveal a signal at 48 hpf, even using epifluorescent illumination. H-L: At 60 hpf, scn5Lab expression appears in the developing lateral line (I,L, arrows). In the trunk, expression is detected by epifluorescent (K) but not brightfield (J) illumination. L: The sense probe does not reveal a signal at 60 hpf, even using epifluorescent illumination. as, antisense probe; n, notochord; s, sense probe; yse, yolk sac extension. Scale bars = 250 and 100 μm in A (applies to A & H and K, respectively), 100 μm in B (applies to B-G,J-L).