
|
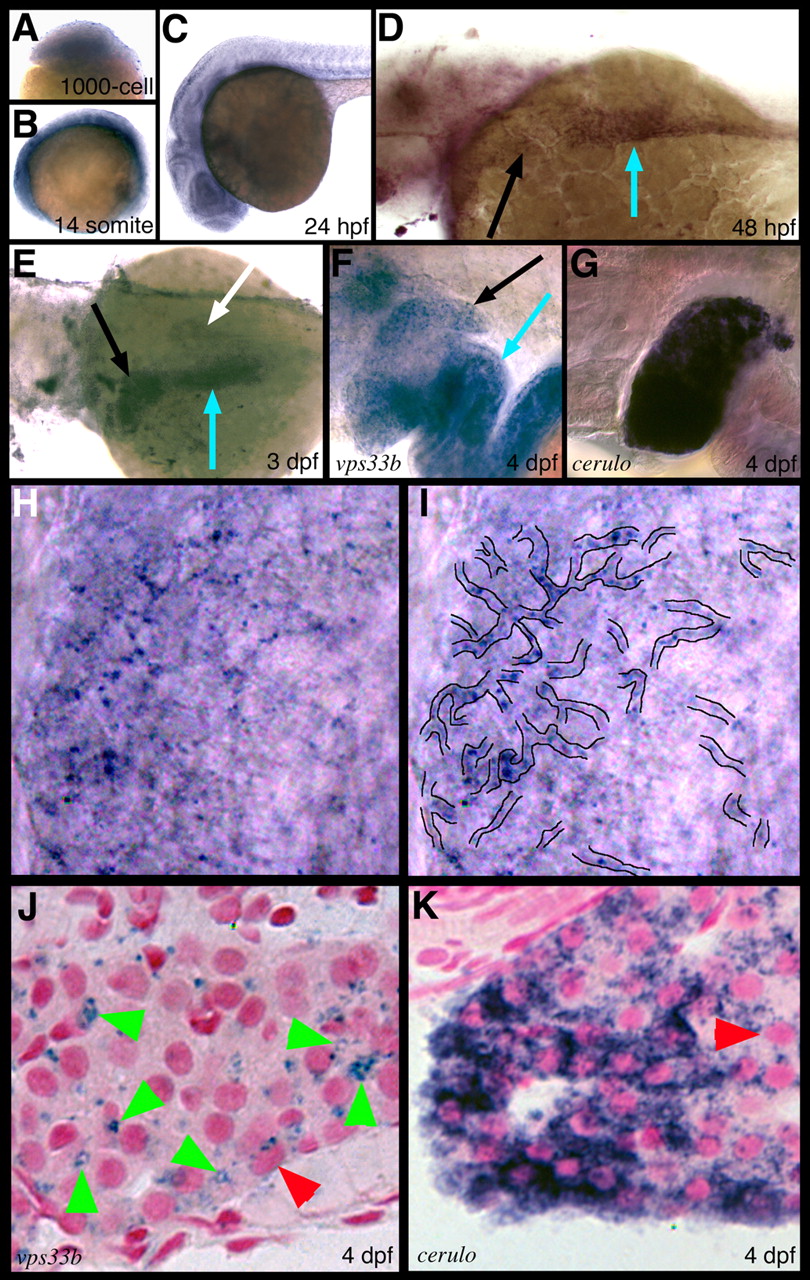
Fig. 2
vps33b expression in zebrafish embryos and larvae. (A-I) Whole-mount RNA in situ hybridization. Sphere stage (A), 10 somite (B) and 24 hpf (C) embryos show diffuse vps33b expression. (D) vps33b expression at 48 hpf is evident in the developing liver (black arrow) and proximal intestine (blue arrow). (E) Lateral view of a 72 hpf larva showing vps33b expression in the liver (black arrow) and proximal intestine (blue arrow). Weak pancreas expression (white arrow) is also evident. (F,G) High-power lateral views of 4 dpf larvae processed for vps33b and ceruloplasmin whole-mount RNA in situ hybridization. Liver (black arrow) demonstrates a reticular pattern of vps33b expression (black arrow) (F) compared with a homogeneous pattern of ceruloplasmin expression (G). Intestinal vps33b expression is also evident (blue arrow, F). (H) Higher power view of liver depicted in F. (I) Enhanced view of H outlining putative ducts. (J,K) Histological cross-sections of a 4 dpf larva processed for vps33b (J) and ceruloplasmin (K) whole-mount RNA in situ hybridization. These panels show punctate regions of vps33b expression in presumptive bile ducts (green arrowheads) and a small number of hepatocytes (red arrowheads). Biliary epithelial cell size and cytoplasm in these panels are comparable with biliary epithelial cell ultrastructure (Fig. 5) (Lorent et al., 2004; Matthews et al., 2004).