
|
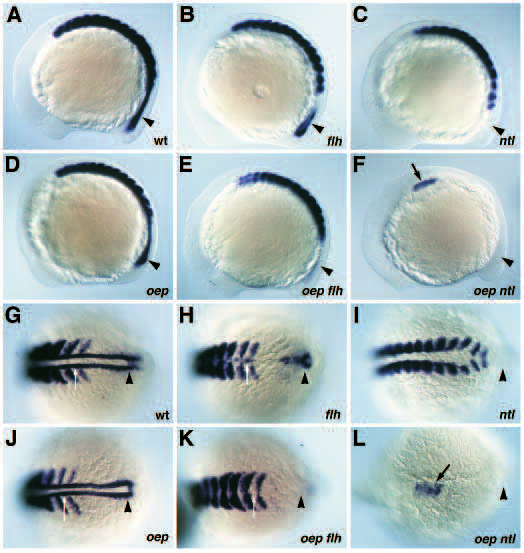
Fig. 11 Expression of myoD in oep flh and oep ntl double mutants. (A-F) Lateral view of myoD expression in wild-type (A), flh (B), ntl (C), oep (D), oep flh (E) and oep ntl (F) mutant embryos at the 11-12 somites stage. (G-L) Dorsal view of myoD expression in wild-type (G), flh (H), ntl (I), oep (J), oep flh (K), and oep ntl (L) mutant embryos. G-K display the posterior expression domain of myoD, (L) displays the anterior most and only expression domain of myoD in oep ntl double mutants. Adaxial cells located between the last two presumptive somites expressing myoD are indicated by a white arrow. Note that this cell population is fused in flh mutant embryos (H) and that myoD expression at this position is absent in ntl mutant and oep flh double mutant embryos. The posterior-most expression domain of myoD (arrowhead) is also drastically reduced in oep flh double mutants and absent in ntl mutants. Black arrow in F,L indicates the formation of a cluster of myoD expressing cells in the anterior trunk of oep ntl double mutants.