
IMAGE
Fig. 7
- ID
- ZDB-IMAGE-050711-7
- Publication
- Perkins et al., 2005 - dazed gene is necessary for late cell type development and retinal cell maintenance in the zebrafish retina
- All Figures
- Figures for Perkins et al., 2005
Image
|
Figure Caption
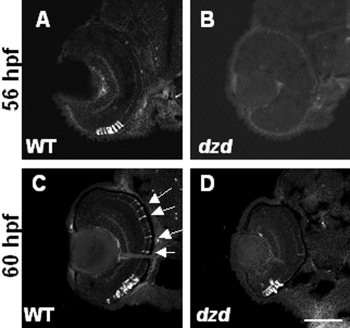
Fig. 7 Marker analysis of early rod photoreceptor appearance. A-D: 1D1 antibodies were used to label rod photoreceptor cells in wild-type (WT, left) and dazed (right) embryos at either 56 hours postfertilization (hpf, A,B) or 60 hpf (C,D). Note that rods are present in the central and dorsal retina in wild-type embryos at 60 hpf (arrows) but not dazed embryos. Also notice the similarity in staining between wild-type at 56 hpf and dazed at 60 hpf (compare A with D). Scale bar = 90 μm in D (applies to A-D).
Acknowledgments
This image is the copyrighted work of the attributed author or publisher, and
ZFIN has permission only to display this image to its users.
Additional permissions should be obtained from the applicable author or publisher of the image.
Full text @ Dev. Dyn.