
IMAGE
Fig. 1
- ID
- ZDB-IMAGE-050711-2
- Publication
- Perkins et al., 2005 - dazed gene is necessary for late cell type development and retinal cell maintenance in the zebrafish retina
- All Figures
- Figures for Perkins et al., 2005
Image
|
Figure Caption
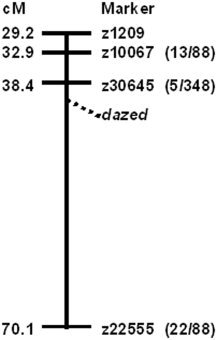
Fig. 1 Genetic mapping revealed dazed is on linkage group 3 (LG3). A schematic cartoon of LG3 shows the genetic position of four SSLP z-markers and the approximate position of the dazed locus. The numbers in parentheses represent the number of recombinants and the total number of mutants tested for each SSLP marker.
Acknowledgments
This image is the copyrighted work of the attributed author or publisher, and
ZFIN has permission only to display this image to its users.
Additional permissions should be obtained from the applicable author or publisher of the image.
Full text @ Dev. Dyn.