
|
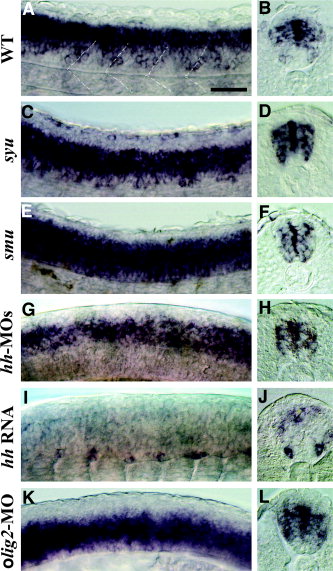
Fig. 4 iro3 expression is regulated by Hedgehog (Hh) signals and Olig2. Lateral trunk views (A,C,E,G,I,K) and cross-sections through the trunk (B,D,F,H,J,L) showing iro3 in situ hybridization at 24 hours postfertilization (A-D) and 18-20 somites (E-L). A,B: Wild-type (WT) embryos. C,D: syu mutants. E,F: smu mutants. G,H: Wild-type embryos injected with hh-morpholino antisense oligonucleotides (MO), a severely affected embryo (G) and a slightly less severely affected embryo (H). I,J: Wild-type embryos injected with hh RNA. K,L: Wild-type embryos injected with olig2-MO. Dotted white lines in A demarcate somite boundaries. Scale bar = 50 μm in A (applies to A-L).