
|
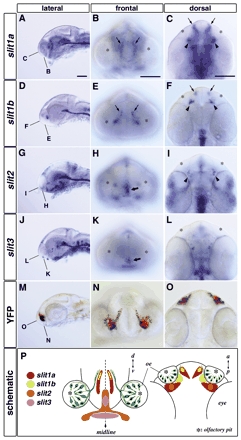
Fig. 5 Spatial expression patterns of four Slit mRNAs are consistent with a function as repulsive cues for the olfactory axons. Heads of 30-hpf whole-mounted embryos hybridized with slit1a (A-C), slit1b (D-F), slit2 (G-I) and slit3 (J-L) probes. The olfactory axon trajectory of a Tg(OMP2k:gap-YFP)rw032a transgenic embryo stained with anti-GFP antibody is shown in M-O. slit1a, slit1b and slit2 are expressed in bilateral clusters of cells located near the boundary between the telencephalon and diencephalon (arrowheads in C,F,I). slit1a and slit1b are also expressed bilaterally in the telencephalon (arrows in B,C,E,F). slit2 and slit3 are expressed along the midline in the ventral forebrain (thick arrows in H,K). The correlation between the regions of Slit expression and the olfactory axon trajectory (green) is schematized in P. A,D,G,J,M, lateral views with anterior to the left; B,E,H,K,N, frontal views with dorsal to the top; C,F,I,L,O, dorsal views with anterior to the top. The focal planes of frontal (B,E,H,K,N) and dorsal (C,F,I,L,O) views are indicated in the corresponding leftmost panels (A,D,G,J,M). Asterisks mark the position of the olfactory pit. Scale bar: 100 µm.