
Fig. 4
|
OPTICS: MAGNIFICATION: DATE OF IMAGE: SUBMITTER COMMENTS:
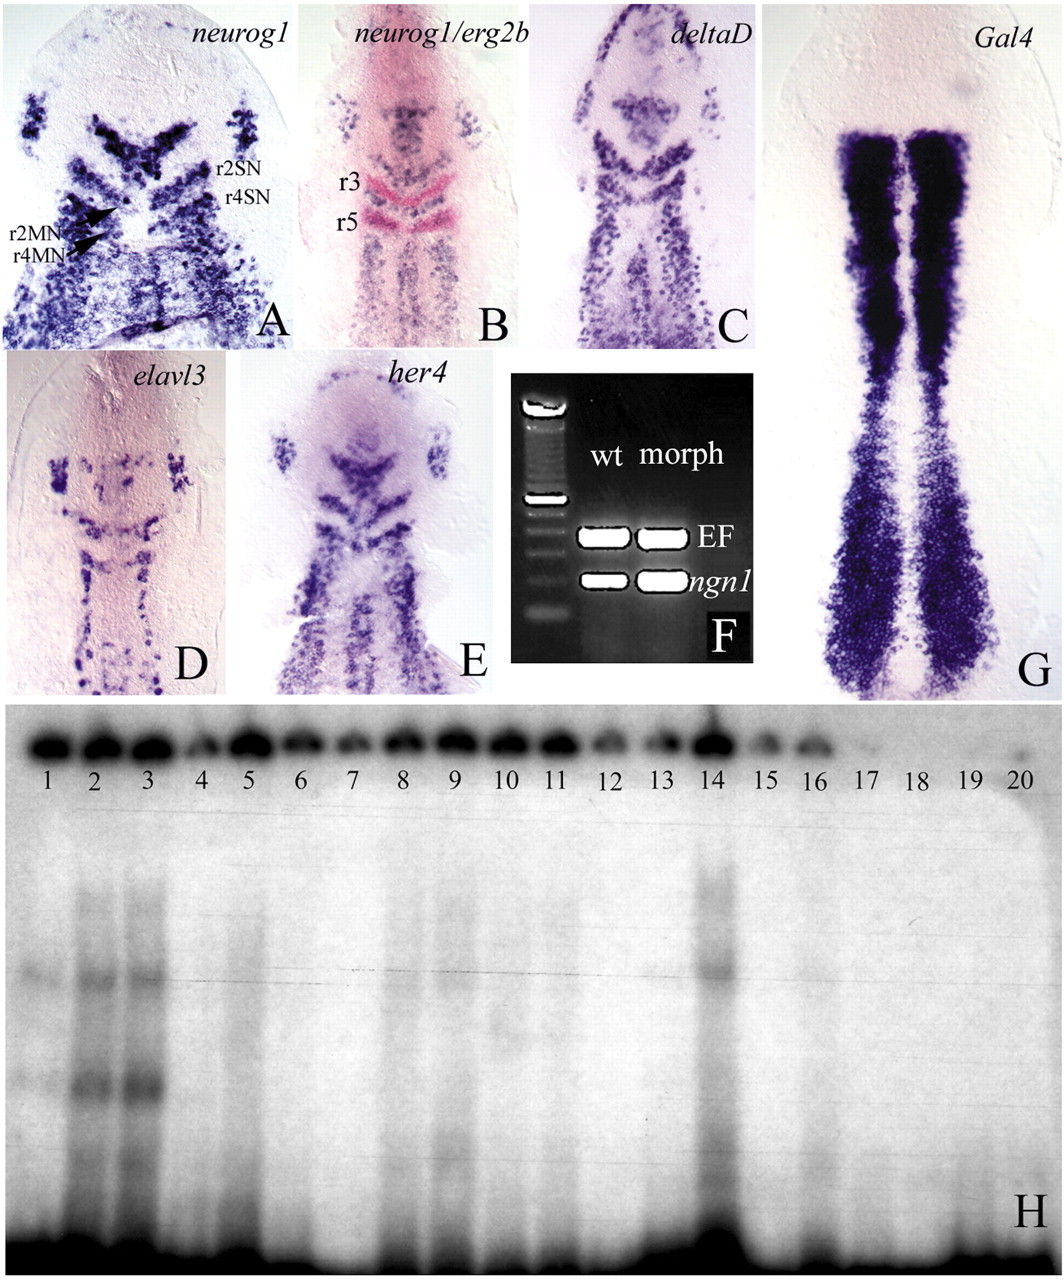
Fig. 4 (A-E) Flat preparations of embryos at the one-somite (A) and two- to three-somite (B-E) stages, which had been injected with morpholino oligonucleotides against her3. The embryos were hybridised with the probes indicated. Note the ectopic expression of neurog1, deltaD and elavl3 transcripts in the region between 2SN and 2MN, and 4SN and 4MN (see Fig. 1D′). Double in situ hybridisation with egr2b (B) shows that ectopic expression is restricted to rhombomeres 2 and 4. (r3, r5: rhombomeres 3 and 5). (F) The density of her3 transcripts following injection of her3 morpholinos is higher than in the wild type (compare with Fig. 1F). (D) Wild-type embryo injected with her3 morpholinos, showing that the density of her3 transcripts is higher than in the controls (compare with Fig. 1E), suggesting that Her3 regulates its own transcription. (H) Her3 protein can bind to N boxes in the her3 promoter. Lanes 1-3 contain increasing amounts of Her3 protein (1, 5 and 10 µg, respectively) and 8000 cpm of an oligonucleotide derived from the her3 promoter that includes the N1 box (see Materials and methods). A clear shift in the electrophoretic mobility of the oligonucleotide can be detected. The presence of several bands suggests binding by Her3 oligomers. Lanes 4-6 contain 3 µg of Her3 protein, 8000 cpm of the labelled N1 oligonucleotide, and increasing amounts of unlabelled oligonucleotide (0.4, 5 and 6 pM, respectively). Binding to the labelled probe is reduced because the unlabelled oligonucleotides compete for Her3. Lanes 7-9 show the same experiment using an oligonucleotide that contains the N2 box (refer to Materials and methods). The shifted band is weaker. Lanes 10-12 show that, also in this case, the non-radioactive oligonucleotide competes for Her3. Lanes 7-9 and 10-12 contain the same amounts of protein and radioactive and non-radioactive DNA as lanes 1-3 and 4-6, respectively. Lanes 13-14 and 15-16 show the effects of mutating either the N1 or the N2 box on band shifting. Lanes contain 1 and 5 µg of Her3 protein and 8000 cpm of the labelled oligonucleotides. As a control, lanes 17-20 contain 8000 cpm of the wild-type (17-18) and mutated (19-20) oligonucleotides, but no Her3 protein.
| Preparation | Image Form | View | Direction |
| not specified | still | not specified | not specified |