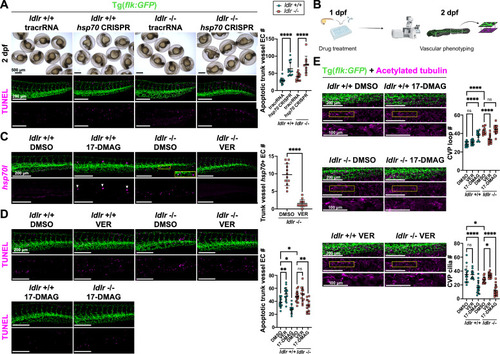
Genetic and pharmacological modulation indicates hsp70 upregulation inhibits vascular apoptosis, remodeling angiogenesis and ciliogenesis during embryonic zebrafish development.
A Brightfield microscopy of ldlr + /+ and ldlr-/- zebrafish following acute hsp70 CRISPR knockout or control tracrRNA injection at 2 dpf (top, left). Confocal microscopy of TUNEL-stained trunk vasculature is shown (bottom, left). Number of apoptotic endothelial cells in trunk vasculature in ldlr + / + tracRNA (n = 13) vs ldlr + / + hsp70 gRNA (n = 13); p < 0.0001; and ldlr-/- tracRNA (n = 13) vs ldlr-/- hsp70 gRNA (n = 10); p < 0.0001; 3 independent experiments. Data are mean ± s.d. One-way ANOVA and Holm-Sidak’s multiple comparison used (right). B Schematic of zebrafish drug treatment (1-2 dpf) followed by vascular staining and phenotyping. Created in BioRender. Kaveh, A. (2026) https://BioRender.com/pwxcj5h. C Confocal microscopy of hsp70l fluorescence in situ RNA hybridization-stained Tg(flk:GFP) ldlr + / + zebrafish treated with 50 μM 17-DMAG and ldlr-/- zebrafish treated with 50 μM VER-155008 at 2 dpf. Arrowheads indicate neuromast hsp70 expression. Inset shows caudal venous plexus (CVP) hsp70 + endothelial cells adjacent to CVP loops (left). Total number of trunk vessel hsp70 + endothelial cells in ldlr-/- zebrafish treated with DMSO (n = 12) or 50 μM VER-155008 treated (n = 13); p < 0.0001; 3 independent experiments. Data are mean ± s.d. Paired two-tailed t test was used (right). D Confocal microscopy of TUNEL-stained trunk vasculature in ldlr + / + and ldlr-/- zebrafish treated with 50 μM VER-155008, and 50 μM 17-DMAG or DMSO (left). Total number of trunk vessel apoptotic endothelial cells in zebrafish treated with 50 μM VER-155008 (n = 13-16), 50 μM 17-DMAG (n = 12) or DMSO (n = 15). Ldlr + /+ DMSO vs ldlr-/- DMSO (p = 0.0469); ldlr + / + DMSO vs ldlr + / + VER (p = 0.0018); ldlr + /+ DMSO vs ldlr + / + 17-DMAG (p = 0.0136); ldlr-/- DMSO vs ldlr-/- VER (p = 0.1680); ldlr-/- DMSO vs ldlr-/- 17-DMAG (p = 0.0029); 3 independent experiments. Data are mean ± s.d. Two-way ANOVA and Holm-Sidak’s multiple comparison used (right). E Confocal microscopy of acetylated tubulin-stained trunk vasculature in ldlr + / + and ldlr-/- zebrafish treated with 50 μM 17-DMAG, 50 μM VER-155008 or DMSO at 2 dpf. Insets show CVP cilia (left). CVP loop number in zebrafish treated with 50 μM VER-155008 (n = 12-13), 50 μM 17-DMAG (n = 12-13) or DMSO (n = 11-12) (top, right). CVP cilia number in zebrafish treated with 50 μM VER-155008 (n = 14), 50 μM 17-DMAG (n = 14) or DMSO (n = 13-14) (bottom, right). Ldlr + /+ DMSO vs ldlr-/- DMSO (loop number: p < 0.0001 and cilia number: p = 0.0385); ldlr + /+ DMSO vs ldlr + /+ VER (loop number: p = 0.4090 and cilia number: p = 0.9501); ldlr + /+ DMSO vs ldlr + /+ 17-DMAG (loop number: p < 0.0001 and cilia number: p < 0.0001); ldlr-/- DMSO vs ldlr-/- VER (loop number: p < 0.0001 and cilia number: p = 0.0475); ldlr-/- DMSO vs ldlr-/- 17-DMAG (loop number: p = 0.6249 and cilia number: p < 0.0001); 3 independent experiments. Data are mean ± s.d. Two-way ANOVA and Holm-Sidak’s multiple comparison used. Source data are provided as a Source Data file.
|
