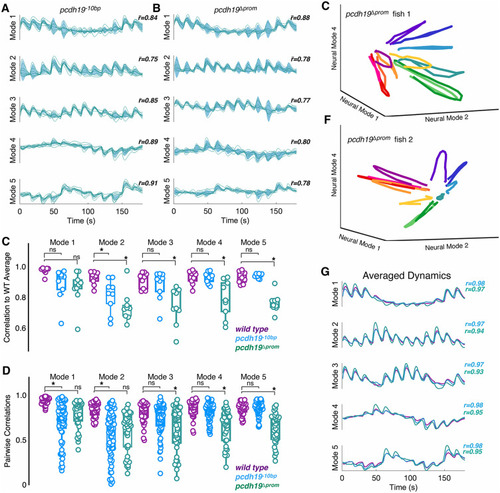
Mutations in pcdh19 lead to altered neural dynamics.
A,B. Shown are latent dynamics determined from trial averaged neural data collected in homozygous pcdh19-10bp (A) and pcdh19Δprom (B) mutant larvae. Individual traces are in teal and the shaded area in blue indicates the group variance. The value, r̄, represents the mean correlation of each individual neural mode to the group averaged neural mode. We obtained a total of 3589 visually responsive neurons from pcdh19-10bp larvae, and 2172 neurons from pcdh19Δprom larvae. C. Boxplot shows the correlation of individual trial-averaged neural modes to the wild type average (wild type, n = 9; pcdh19-10bp, n = 12; pcdh19Δprom, n = 9; *p < 0.05, Dunnett’s test). D. Pairwise within-group correlations of neural modes for each genotype (wild type,n = 36; pcdh19-10bp, n = 66; pcdh19Δprom, n = 36; *p < 0.05, Dunnett’s test). E,F. Three-dimensional representations of latent dynamics of individual pcdh19Δprom mutant larvae. The view is the same as in Fig 2G-2I. G. Neural modes were averaged within each genotype (wild type/purple, pcdh19-10bp/blue, pcdh19Δprom/teal. The value, ![]() r, represents the correlation of each mutant average with the wild type average (pcdh19-10bp/blue, pcdh19Δprom/teal). r, represents the correlation of each mutant average with the wild type average (pcdh19-10bp/blue, pcdh19Δprom/teal).
|
