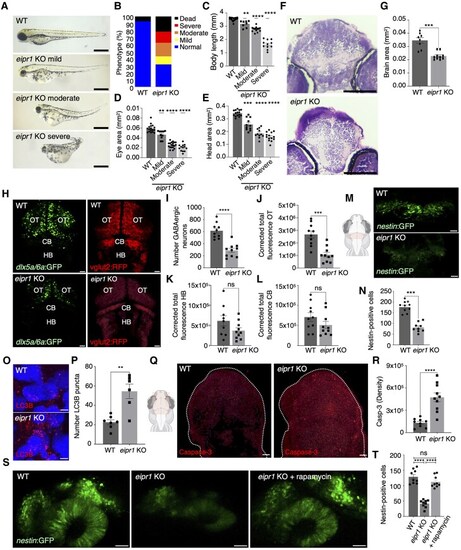
Morphological and cellular defects in eipr1 knockout (KO) zebrafish. (A) Morphology of wild-type (WT) and EARP-interacting protein 1 (eipr1) KO zebrafish larvae at 3 days post-fertilization (3 dpf). Scale bar = 1 mm. (B) Frequency of phenotypes observed for WT and eipr1 KO larvae (N = 3, n = 235–245). (C–E) Body length (C), eye area (D) and head area (E) of WT and eipr1 KO larvae at 3 dpf (N = 3, n = 11–15 for head, 8–18 body length, n = 10–19 for eye area). (F) Haematoxylin and eosin (H&E) staining of paraffin-embedded brain sections from the midbrain of 3 dpf WT and eipr1 KO larvae. Scale bar = 100 μm. (G) Quantification of brain size of eipr1 KO larvae (N = 10) relative to WT (N = 8) at 3 dpf. (H) Representative images of GABAergic neurons (dlx5a/6a:GFP) and glutamatergic neurons (vglut2:RFP) in WT versus eipr1 KO zebrafish brain at 3 dpf. Scale bar = 30 µm. (I) Quantitative analysis demonstrating a significant decrease in the number of GABAergic neurons (dlx5a/6a:GFP) in eipr1 KO (90) compared with WT brain at 3 dpf, n = 10. (J) Quantitative analysis demonstrating a significant decrease in the corrected total fluorescence of glutamatergic neurons (vglut2:RFP) in eipr1 KO compared with WT zebrafish optic tectum (OT) at 3 dpf, n = 10. (K) Quantitative analysis demonstrating no significant changes in the corrected total fluorescence of glutamatergic neurons (vglut2:RFP) in eipr1 KO compared with WT zebrafish hind brain at 3 dpf, n = 10. (L) Quantitative analysis demonstrating no significant changes in the corrected total fluorescence of glutamatergic neurons (vglut2:RFP) in eipr1 KO compared with WT zebrafish cerebellum at 3 dpf, n = 10. (M) Representative images of neural progenitors (nestin:GFP) in WT versus eipr1 KO zebrafish brain at 3 dpf. Scale bar = 30 µm. (N) Quantitative analysis demonstrating a significant decrease in the neural progenitors (nestin:GFP) in eipr1 KO brain (81.67 ± 7.330) compared with WT zebrafish at 3 dpf, n = 9. (O) Immunostaining of autophagosomes (LC3B, red) and nucleus (Hoechst, blue) in WT versus eipr1 KO zebrafish body at 2 dpf. Scale bar = 2 µm. (P) Quantitative analysis demonstrating a significant increase in the number of autophagosomes in eipr1 KO zebrafish compared with WT zebrafish body at 2 dpf, n = 6–7. (Q) Immunostaining of caspase-3 in WT versus eipr1 KO zebrafish brain at 3 dpf. Scale bar = 30 µm. (R) Quantitative analysis demonstrating a significant increase in the integrated density of caspase-3 signal in eipr1 KO zebrafish compared with WT zebrafish brain at 3 dpf, n = 9–10. (S) Representative images of neural progenitors (nestin:GFP) in WT, eipr1 KO and eipr1 KO treated with 100 nM rapamycin in zebrafish brain at 1 dpf. Scale bar = 40 µm. (T) Quantitative analysis demonstrating a significant decrease in the neural progenitors (nestin:GFP) in eipr1 KO compared with WT zebrafish. Treatment of eipr1 KO zebrafish with rapamycin resulted in a significant increase in neural progenitors (nestin:GFP) compared with eipr1 KO zebrafish brain at 1 dpf, n = 9. All data are presented as the mean ± SEM. Statistical significance was calculated by Student’s t-test, or one-way ANOVA followed by Dunnett’s T3 multiple comparisons test. **P < 0.01, ***P < 0.001, ****P < 0.0001, ns: not significant. GFP = green fluorescent protein; RFP = red fluorescent protein.
|
