
FIGURE 5
- ID
- ZDB-FIG-260520-78
- Publication
- Ononuju et al., 2026 - Employing zebrafish to understand genetic drivers of epilepsy-related comorbid behaviors
- Other Figures
- All Figure Page
- Back to All Figure Page
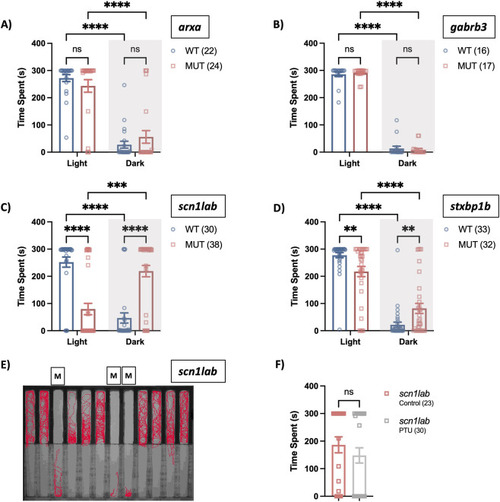
Scototaxis behavior in epilepsy lines. (A–D)Arxa, gabrb3, scn1lab and stxbp1b lines were subjected to the light-dark preference assay. Breeders were in-crossed and on day 6, larvae were transferred into the center of the 12-lane custom preference chamber. After 2 min in the DanioVision, time spent (s) in the dark versus light arena was measured for 5 min. (E) Representative figure showing cumulative scn1lab larval movement as indicated by red traces. Mutants are highlighted by label “M”. (F) Clutches generated from scn1lab were treated with PTU from 1-4 dpf. Light-dark preference behavior was assessed at 6 dpf using the device (via time-spent in light arena). Data displayed as mean ± SEM. Statistical analyses: (A–D) Two-way ANOVA with multiple comparison Fisher’s LSD test **p < 0.01, ***p < 0.001 and ****p < 0.0001. F) Two-tailed Mann-Whitney U test, *p < 0.05. |
| Fish: | |
|---|---|
| Observed In: | |
| Stage: | Day 6 |