
Fig. 4
- ID
- ZDB-FIG-260423-4
- Publication
- Grassi et al., 2026 - Patient-Derived in Vitro Models Reveal Insights into Medullary Thyroid Cancer Microenvironment and Resistance to Tyrosine Kinase Inhibitors
- Other Figures
- All Figure Page
- Back to All Figure Page
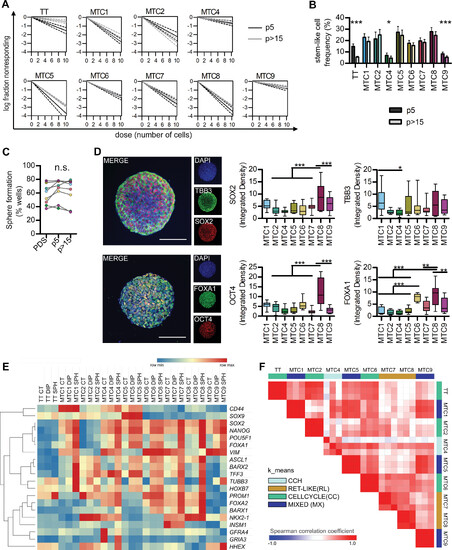
MTC cell lines maintain a stem-like phenotype and high plasticity. (A) Extreme Limiting Dilution Analysis (ELDA) plots showing the logarithm of the fraction of non-responding samples vs. the number of cells seeded at early (p5) and late (p > 15) passages. Steeper slopes indicate a higher fraction of cells with clonal abilities. Most MTC lines show a higher stem-like behavior than TT cells, both at early and late passages. MTC4 (CCH) and MTC9 show a reduced stem-like behavior than other MTC lines, although stable in time. TT immortalized cells show a reduced stem-like behavior that is even more evident in later passages. n = 3. (B) Stem-like cell frequency as calculated by ELDA experiments at early (darker tone) and late (lighter tone) passages, highlighting differences in stem-like cells among the different cell lines. n = 3. (C) primary sphere formation assay showing the maintenance of similar stem-like clonal growth abilities between Patient Derived Spheroids (PDS) and MTC adherent lines at early (p5) and late (p > 15) passages, demonstrating the stability of the model. Each dot represents a different cell line, n = 8. (D) Representative confocal microscopy images and relative signal intensity quantification of stem markers SOX2 and OCT4 and C-cells and neuroendocrine progenitors markers FOXA1 and TBB3 in clonal spheres derived from adherent MTC cultures, as described in the sphere formation assay, highlighting the variability of the markers expression among the different lines. n = 12 for MTC1, MTC2, MTC4, MTC5 and MTC9, n = 11 for MTC6, MTC7 and MTC8. Scalebar 100 µm. (E) Gene expression panel of selected neuroendocrine, C-cells, and MTC-related stem/progenitor markers describing variations among cells cultivated in control condition (CT) and two stem-promoting conditions, DIP-induced pseudohypoxia (DIP) and clonal sphere selection (SPH). Heatmap representation is assay-centric, with color scale range set as min-to-max independently for each row. Heatmap highlights that TT cells had lower levels of almost all stem-related genes, with only significant induction in TUBB3 and PROM1 (coding for CD133) under stem-promoting conditions, but the primary MTC cells showed a variable pattern of induction, with MCT5 and MCT6 having similar behaviors in hypoxia and in sphere growth, while MTC1, MTC7 and MTC8 having greater response in clonal cultures than in hypoxia. Shown are the mean values of six independent replicates for all lines except MTC4 where n = 4. (F) similarity matrix and k_Means Clustering based on gene expression data at point C. Color scale represents correlation coefficient values as described in color range legend. k_Means Clustering revealed three main groups defined as follows: Cell Cycle group (CC), comprise immortalized and p53 mutated TT cells, MTC2 which has genetic cell cycle dysregulation by CDKN1B mutation, and MTC6, RAS mutated, derived from an aggressive tumor of significant dimensions; RET-like group (RL) comprise the two lines with classical RET mutations, MTC7 and MTC8; Mixed group (MX) comprise RAS-mutated MTC1, RET-mutated MTC5, and MTC9, of unknown genetic alterations. MTC4, that is the only one derived from C-cell hyperplasia, was different than all the other ones. Data presented as ELDA estimated value ± range (B), paired dot blot (C), box and whiskers (5–95 percentile) (D), heatmap of log2 fold change (E), similarity matrix (F). Statistical analysis: ELDA (B), Repeated Measures ANOVA (C), Kruskal–Wallis test followed by Dunn’s Multiple Comparison Test (D), Pearson’s correlation with complete linkage method (E), Spearman correlation coefficient and k_Means Clustering in 4 groups (F). |