
FIGURE 2
- ID
- ZDB-FIG-251115-164
- Publication
- Bolanos-Palmieri et al., 2025 - Kynurenine Pathway Dysregulation Impairs Podocyte Morphology and Bioenergetics In Vitro and Leads to Glomerular Dysfunction
- Other Figures
- All Figure Page
- Back to All Figure Page
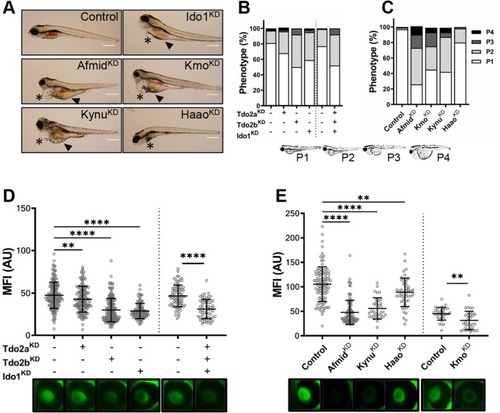
Morpholino‐induced KD of the enzymes of the kynurenine pathway leads to edema formation and proteinuria in zebrafish. Targeted knockdown of the enzymes of the main axis of the kynurenine pathway was carried out by morpholino injection in zebrafish embryos at the 1–4 cell stage. Phenotypic readouts regarding edema formation, ranging from P1 = no edema to P4 = very severe edema, as well as quantification of proteinuria, were recorded at 96 hpf. Proteinuria was assessed by measuring the maximum fluorescence intensity (MFI) of circulating eGFP‐DBP in the retinal vessel plexus of the larvae; a reduction in the signal is used as an indicator of proteins being lost from the circulation. (A) Representative phenotypes of the morphant zebrafish larva at 96 hpf. Knockdown of the enzymes induces yolk sac edema (▲) and pericardial effusion (*) in the injected larvae. Scale bar = 500 μm. (B) Proportion of affected larvae after knockdown of Ido1, Tdo2a and Tdo2b, represented as percentages. (C) Quantification of the larvae belonging to each phenotype category according to the severity of edema formation after disruption of the kynurenine enzymes downstream of the Ido/Tdo node, data shown as percentages. (D) Knockdown of Ido1, Tdo2a and Tdo2b induces proteinuria, as shown by a reduction in the fluorescence signal from the circulating eGFP‐tagged protein. (E) The reduction of the intravascular MFI after knockdown of all other enzymes from the main axis of the pathway shows that their dysregulation also leads to proteinuria. Below each graph showing the MFI quantification is a photograph of the retinal blood vessel plexus of a larva representative for each of the groups ( |
| Fish: | |
|---|---|
| Knockdown Reagents: | |
| Observed In: | |
| Stage: | Day 4 |