
FIGURE
Fig. 3
- ID
- ZDB-FIG-250909-78
- Publication
- Yin et al., 2025 - Novel susceptibility gene SLC23A2 functions via PI3K-AKT-mTOR pathway in etiology of non-syndromic cleft palate
- Other Figures
- All Figure Page
- Back to All Figure Page
Fig. 3
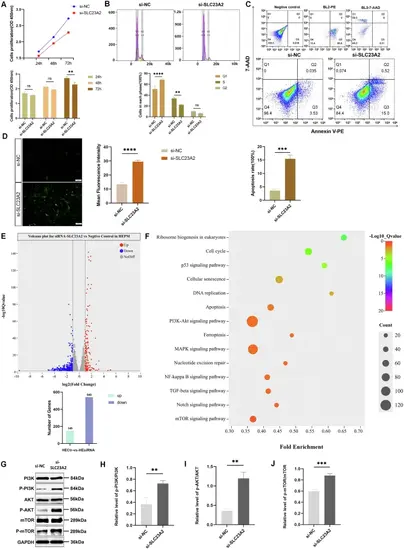
Changes of cell biology and ROS in HEPM after SLC23A2 knockdown. A Cell proliferation after knockdown of SLC23A2. B Cell cycle after knockdown of SLC23A2. C Cell apoptosis after knockdown of SLC23A2. D ROS level after knockdown of SLC23A2. E Volcano plot for differential expression gene (DEG). F GO analysis for DEGs. G–J Western Blot for proteins in PI3K-AKT-mTOR signaling pathway. Error bars represent SD. n = 3; ns, P > 0.05; *,P < 0.05; **,P < 0.01; ***,P < 0.001; ****,P < 0.0001 |
Expression Data
Expression Detail
Antibody Labeling
Phenotype Data
Phenotype Detail
Acknowledgments
This image is the copyrighted work of the attributed author or publisher, and
ZFIN has permission only to display this image to its users.
Additional permissions should be obtained from the applicable author or publisher of the image.
Full text @ J. Hum. Genet.