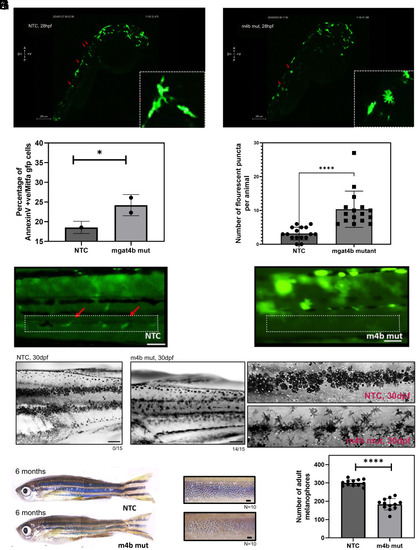
Melanocyte specific ablation of mgat4b leads patterning abnormalities and reduced adult melanophores. (A and B) Snapshot of time-lapse imaging showing early melanophore migration. Red arrows in NTC animal shows elongated melanophores migrating in dorsolateral or dorsomedial direction (Inset) whereas in mgat4b mut animal they mark direction-less star-shaped melanophores (Inset). (Scale bar, 200 µm.) (C) The bar graph represents mean ± SEM of percentage of Annexin V+/mitfa gfp+ cells in NTC and mgat4b mutant animals, n = 3, unpaired t test, P = 0.0138. (D) The bar graph represents mean ± SEM of number of fluorescent puncta per animal in NTC and mgat4b mutants, n = 2, unpaired t test, P ≤ 0.0001. (E and F) Lateral view of tissue specific NTC and mgat4b mut at 7dpf showing melanocyte stem cells (McSCs) residing pattern. The red arrows and the white dotted box highlight the distribution of McSCs in the trunk region. (G and H) Lateral view of 1 mo old NTC and mgat4b mut animal showing pigment stripes after metamorphosis (Left) zoomed images showing well, melanized irregularly circular shaped melanophores in NTC and dendritic star shaped melanophores in mutant (Right) 14/15 indicates 14 out of 15 fish imaged as shown in the representative image show the aberrant phenotype. (Scale bar, 50 µm.) (I) Lateral view of 6 mo old NTC and mgat4b mut animal showing adult pigment stripes, the zoomed images on the right shows constricted melanophores upon epinephrine treatment. (Scale bar, 1,000 µm.) (J) The bar graph represents mean ± SEM of melanophore count in adult stripes in NTC and mgat4b mut animals *P ≤ 0.05, **P ≤ 0.01, ***P ≤ 0.001, ****P ≤ 0.0001 and ns P > 0.05.
|
