FIGURE

Figure 2.

ID
ZDB-FIG-250307-32
Publication
Liu et al., 2024 - The circadian clock orchestrates spermatogonial differentiation and fertilization by regulating retinoic acid signaling in vertebrates
Other Figures
All Figure Page
Back to All Figure Page
Figure 2.

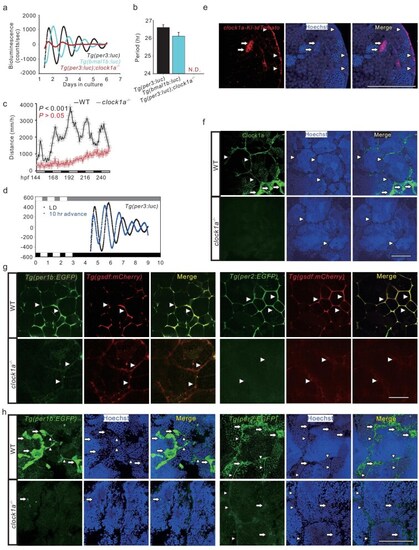
The zebrafish testis clock ticks in a cell-specific manner. (a and b) Bioluminescence recordings (a) and their periods (b) of the testis cultured ex vivo from Tg(per3: luc) (black), Tg(per3: luc); clock1a−/− (red) and Tg(bmal1b: luc) (cyan), detrended by 24-hour moving average (n = 10). (c) Locomotor rhythm analysis of 5- to 9-dpf (days postfertilization) WT (black) and clock1a−/− (red) zebrafish larvae under DD condition (n = 24). (d) Detrended bioluminescence of Tg(per3: luc) testis recordings under 10-hour advanced conditions after the culture ex vivo for 3 days under normal LD (n = 4). (e) Confocal images of the testis from clock1a-KI-tdTomato zebrafish (n = 3). (f) Confocal images of IHC staining in clock1a−/− and WT control testes with a mouse CLOCK antibody (n = 6). (g and h) Expression of per1b and per2 in the Sertoli cells (g) and spermatogonia (h), and their downregulation in the clock1a−/− Sertoli cells or spermatogonia, as shown by confocal images of the testes from the Tg(per1b: EGFP; gsdf: mCherry), Tg(per1b: EGFP; gsdf: mCherry); clock1a−/−, Tg(per2: EGFP; gsdf: mCherry), and Tg(per2: EGFP; gsdf: mCherry); clock1a−/− zebrafish lines (n = 5–14). In (e–h), all nuclei were counterstained with Hoechst 33342. Arrowheads indicate Sertoli cells, and arrows spermatogonia. Scale bars =100 μm (Fig. S2 and Movie S1).

Expression Data

Expression Detail
Antibody Labeling
Phenotype Data

Phenotype Detail
Acknowledgments
This image is the copyrighted work of the attributed author or publisher, and ZFIN has permission only to display this image to its users. Additional permissions should be obtained from the applicable author or publisher of the image. Full text @ Natl Sci Rev