Fig. 2
- ID
- ZDB-FIG-250227-9
- Publication
- Deebani et al., 2025 - Knockdown of zebrafish tmem242 enhances the production of ROS that signals to increase f9a expression resulting in DIC-like condition
- Other Figures
- All Figure Page
- Back to All Figure Page
|
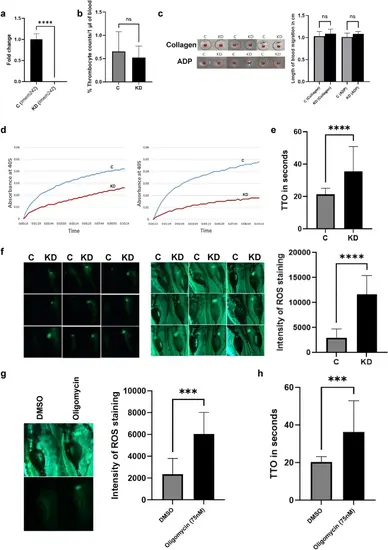
Functional evaluation of tmem242 knockdown. (a) The relative mRNA expression of tmem242 in the control (C) and tmem242 knockdown (KD) zebrafish (n = 4). (b) Comparison of the number of thrombocytes between control and tmem242 knockdown zebrafish (n = 7). (c) Whole blood aggregation assay results showing aggregation in whole blood in response to collagen and ADP agonists for both control and tmem242 knockdown zebrafish (n = 6) (only three replicates for each agonist are shown). Graphs depict the length of blood migration from the well origin down the wall. (d) Kinetic coagulation assays performed using the control and tmem242 knockdown zebrafish plasma (n = 5). Panels represent kinetic curves of fibrin formation in kPTT (left) and kPT (right). (e) Laser-induced venous thrombosis in control and tmem242 knockdown 5-dpf zebrafish larvae (n = 20). The TTO measured in seconds in control and tmem242 knockdown larvae. (f) ROS production in the control and tmem242 knockdown larvae. Images of ROS in zebrafish larvae in the fluorescence dark-field (left) and fluorescence bright-field (right) (n = 9). Each of the nine squares has C (control) and KD (tmem242 knockdown) larvae. The graph represents the fluorescence intensity of ROS signal for the control and the tmem242 knockdown larvae from the fluorescence dark-field. (g) ROS production in the control (DMSO) and oligomycin-treated larvae. Images of ROS in zebrafish larvae in the fluorescence bright-field (top) and fluorescence dark-field (bottom) (n = 9, only one is shown). The graph represents the fluorescence intensity of ROS signal for the control and oligomycin-treated larvae. (h) Laser-induced venous thrombosis in control and oligomycin-treated 5-dpf zebrafish larvae (n = 17). Error bars, mean ± s.d. P values were calculated by Student’s t-test. ***P < 0.001 and ****P < 0.0001; ns not significant. |

