
Fig. 5
- ID
- ZDB-FIG-250227-17
- Publication
- Abello et al., 2024 - Endothelial cell Piezo1 promotes vascular smooth muscle cell differentiation on large arteries
- Other Figures
- All Figure Page
- Back to All Figure Page
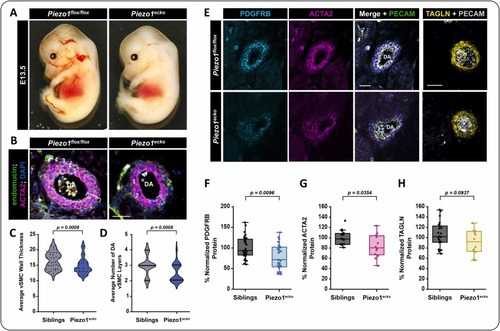
EC-specific Piezo1 knockout reduces vSMC association with the dorsal aorta in mice. A) VE-Cad:Cre mice were crossed to Piezo1flox//flox mice to generate E12.5–13.5 embryos across genotypes. Representative images of a Piezo1flox//flox sibling and an EC-specific Piezo1 deficient embryo (Piezo1ecko) are shown. B) Immunostaining of cross sections of the descending dorsal aorta (DA) in Piezo1flox/flox versus Piezo1ecko E12.5–13.5 embryos. The endothelium is labeled with endomucin in green, vSMCs are labeled with alpha-smooth muscle actin (ACTA2) in magenta, and nuclei (DAPI) are shown in blue. The white bracket indicates the wall thickness of the the vSMC layer, the white numbers indicate the number of vSMC layers present. C) Quantification of the average vSMC wall thickness (um) in Piezo1flox/flox and Piezo1ecko embryos (p = 0.0008, N = 42 siblings; N = 20 Piezo1ecko). Statistical analysis was performed using a two-tail unpaired t-test. D) Quantification of the average number of vMSC layers on the descending DA in Piezo1flox/flox and Piezo1ecko embryos (p = 0.0008, N = 42 siblings; N = 20 Piezo1ecko). Statistical analysis was performed using a two-tail unpaired t-test. Scale bar (B) = 50 μm. E) Immunostaining of cross sections of the descending dorsal aorta (DA) in Piezo1flox/flox versus Piezo1ecko E12.5–13.5 embryos for PDGFRB (cyan), ACTA2 (magenta), and TAGLN (yellow) protein versus PECAM (green or grey depending on panel) to mark the endothelium and budding blood cells. F-H) Quantification of the average immunostaining intensity in vSMCs for; (F) PDGFRB (p = 0.0096, unpaired two-tailed t-test; N = 34 sibling sections; N = 26 Piezo1ecko sections); (G) ACTA2 (p = 0.0354, unpaired two-tailed t-test; N = 16 sibling sections; N = 12 Piezo1ecko sections); and (H) TAGLN (p = 0.0937, unpaired two-tailed t-test; N = 22 sibling sections; N = 12 Piezo1ecko sections). |