|
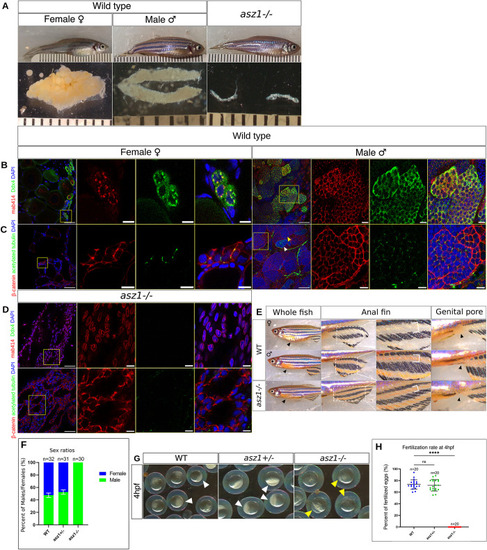
Loss of Asz1 results in germ cell loss and underdeveloped gonads and asz1-/- fish develop as sterile males. A. Representative adult fish at 3 months post-fertilization and their corresponding gonads of the indicated genotypes. Ruler grades are 1mm, showing similar standard lengths (SL) of fish from all genotypes (S3A Fig), but much smaller gonads of asz1-/- compared to wt ovaries and testes. B-C. Representative confocal images of wt ovaries and testes, labeled with Ddx4 (green), mAb414 (red) and DAPI (blue) in B, and with Acetylated tubulin (green), β-Catenin (red) and DAPI (blue) in C. Insets show single and merge channels of magnifications of the yellow boxes in zoomed out images. Scale bars are 50 μm and 10 μm in zoomed out and inset magnification images, respectively. In C, yellow arrowheads indicate zygotene cilia in spermatocytes, and white arrowheads indicate flagella of mature sperm. For each B and C labeling, n = 12 ovaries and 12 testes. D.asz1-/- gonads labeled for, top: Ddx4 (green), mAb414 (red) and DAPI (blue), bottom: Acetylated tubulin (green), β-Catenin (red) and DAPI (blue), as in B-C. n = 6 gonads. E. Dimorphic external sex criteria in wt, and their phenotypes in asz1-/- fish. Left panels show larger abdomen in females (arrowheads). Middle panels show the anal fin (right images are zoomed-in magnifications), with more pigmented stripes (white bracket) in the male. Right panels show the larger genital pore in the female (arrowheads). asz1-/- fish exhibit typical male anatomy of all criteria. The number of analyzed fish is indicated in the plot in F. F. A plot showing the representative sex ratios in each genotype from two independent clutches as determined by the external sex criteria in E. n = number of fish. Bars are mean ± SD. G. Progeny embryos of crosses between wt females and either wt, asz1+/-, or asz1-/- males as indicated, at 4 hpf. Fertilized embryos exhibit an opaque animal pole which results from cellularization during cleavage stages (white arrowheads), while unfertilized eggs exhibit a transparent acellularized animal pole (yellow arrowheads). H. Dot plots showing the fertilization rates per mating from the crosses in G. n = number of cross pairs. Bars are mean ± SD.
|