|
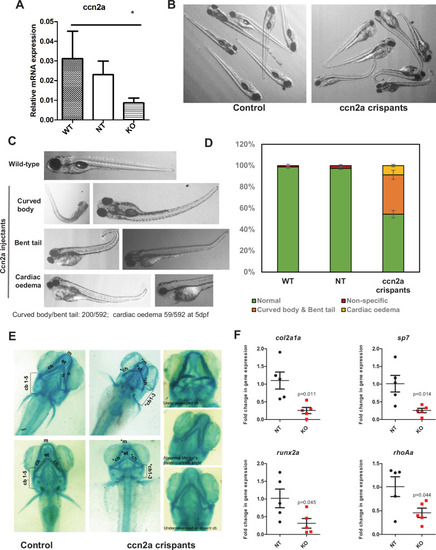
Phenotypes in the ccn2a FO knockout zebrafish. A Relative expression levels of the ccn2a mRNA in the controls (NT) and injectants (crispants). B Bright field image of a group of ccn2a crispants and matched control injectants from the same experiment to illustrate the extent of physical phenotypes. C Representative images of observed phenotypes as labeled, among the ccn2a crispants. D Quantification of the number of larvae showing the indicated phenotypes in each group. E Alcian blue stained images of wildtype and representative examples of ccn2a crispants, showing cartilage deformities. Cartilage elements labeled: m: Meckel’s cartilage; ch: ceratohyal; cb: ceratobranchial pairs. F Fold change in mRNA expression of select markers such as col2a1a (chondrocyte), sp7 (osteoblast), runx2a (early osteoblast) and rho1a (palatogenesis) in the ccn2a crispants as compared to the controls at 5dpf. Results from at least 5 independent experiments (pooled larvae, 30–50/experiment) are quantified.
|