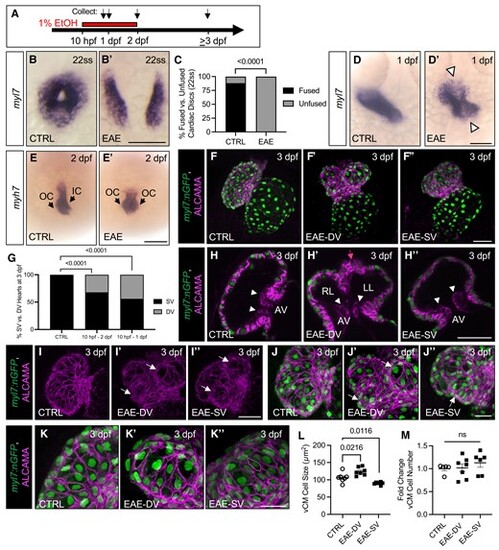
EAE disrupts cardiac disc fusion and heart tube formation, leading to downstream ventricular defects. A. Schematic of EtOH exposure window. B–B’. ISH for myl7 demonstrating EtOH-induced abnormalities in cardiac disc fusion. C. Percent of embryos with an unfused cardiac disc following 1% EtOH exposure (10 hpf–22ss; n = 81/81 unfused in 1% EtOH vs. 12/102 unfused in 0% EtOH). D–E’. ISH for myl7 (24 hpf) and myh7 (48 hpf) demonstrating EtOH-induced abnormalities in the linear heart tube (D–D’) and ventricle (E–E’). F–F’’. Confocal imaging of ALCAMA stained Tg(myl7:nGFP) embryos at 76 hpf showing EAE-DV and EAE-SV phenotypes (76 hpf). G. Rate of single and double ventricle formation (72 hpf) following 1% EtOH from 10 to 48 hpf (n = 29/92 bi-lobed in 1% EtOH vs. 0/98 bi-lobed in 0% EtOH) and 10–24 hpf (n = 36/81 bi-lobed in 1% EtOH vs. 0/98 bi-lobed in 0% EtOH). H–K’’. Confocal imaging of ALCAMA stained Tg(myl7:nGFP) embryos (76 hpf). All EAE embryos have a single AV canal lined with endocardial cushion cells (white arrows), and EAE-DV larvae have a single outflow tract (pink arrow) despite the DV phenotype (H–H’’). EAE-SV and -DV larvae also have defects in cardiomyocyte organization, with the ventricle wall showing lumpy protrusions (white arrows, I–J’’). Abnormalities in cell size were also observed in EAE adults, with EAE-DV ventricles having larger and EAE-SV ventricles having smaller ventricular cardiomyocytes (vCMs [K–K’’]). L–M. Quantification of vCM cell number and cell size (n > 6 per condition, 76 hpf). Data are presented as the standard error of the mean. Statistical significance was determined by Fisher's exact test (C, G) or an unpaired, two-tailed Student's t-test assuming equal variances (L–M). P-values or upper bounds are shown. Scale bars: 100 μm (B–B’, D–D’, E–E’), 50 μm (F–F’’, H–I’), 25 μm (J–K’’). OC, outer curvature, IC, inner curvature; RL, right lobe; LL, left lobe; AV, atrioventricular canal, and ns, non-significant (P > 0.05).
|
