|
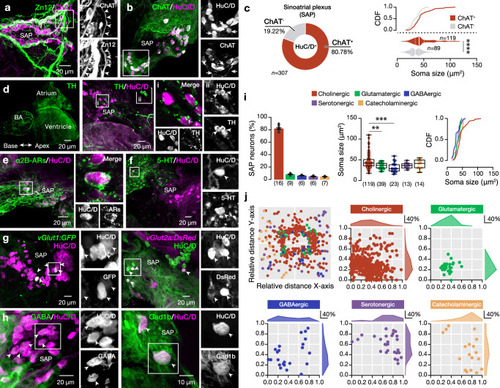
Neurochemical variability in the intracardiac SAP neuronal population. a Representative whole-mount photomicrograph showing the abundance of cholinergic (ChAT+, magenta) neurons and processes in close contact with processes (Zn12+, green) innervating the SAP area. Arrowheads indicate the ChAT+/ Zn12+ neuronal processes. b, c Microphotograph showing that the majority but not all of the SAP neurons (HuC/D+) are cholinergic (ChAT+). Quantification of the proportion of the HuC/D+ that are cholinergic and analysis of the cholinergic (ChAT+) and non-cholinergic (ChAT-) SAP neuron soma sizes. Arrows indicate the non-cholinergic SAP neurons (HuC/D+/ ChAT-). d Whole-mount image shows the TH expression pattern on the adult zebrafish heart. Most SAP neurons (magenta) are in contact with TH+ processes (green) (in i). A small cluster of TH-expressing neurons in ii. e HuC/D+ neurons and processes in SAP express the adrenoceptor a2B, indicating the presence of strong adrenergic innervation. f Presence of serotonin (5-HT+) expressing neurons. g Identification of glutamatergic neurons (vGlut1+ and vGlut2a+) in SAP neuronal population. h SAP contains some GABAergic (GABA+ and Gad1b+, green) neurons. i. Analysis of the proportion of SAP neurons expressing different neurotransmitters. Quantification and cumulative frequency of the neurochemically distinct neuron soma sizes. j Spatial distribution pattern of neurons expressing different neurotransmitters in SAP area. Arrowheads indicate the double-labeled neurons. 5-HT 5-hydroxytryptamine/serotonin, AR adrenergic receptor, CDF cumulative distribution frequency, ChAT choline acetyltransferase, GABA γ-Aminobutyric acid, Gad1b Glutamate decarboxylase 1, HuC/D elav3 + 4, SAP sinoatrial plexus, TH Tyrosine Hydroxylase, vGlut vesicular glutamate transporter, Zn12 neuronal cell surface marker (HNK-1). Data are presented as mean ± s.e.m., as violin plots, or as box plots showing the median with 25/75 percentile (box and line) and minimum–maximum (whiskers). ****P < 0.0001. For detailed statistics, see Supplementary Table 1. Source data are provided as a Source Data file.
|