|
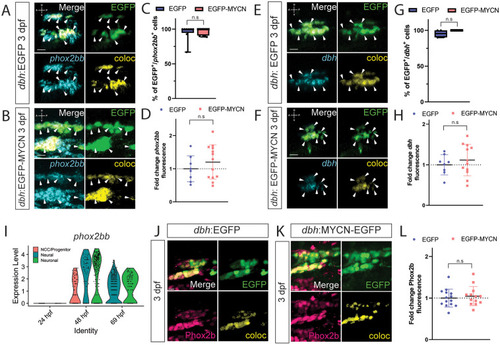
MYCN overexpressing cells contain a SAP gene expression signature at 3 dpf. A,B,E,F) WICHCR performed using HCR probes against phox2bb (A,B) or dbh (E,F) and with antibody against EGFP on 3 dpf dbh:EGFP (A,E) and dbh:EGFP-MYCN (E,F) larvae. Representative images reveal expression of the markers and their colocalized channel (coloc) within the SCG. C,G) Percentage of EGFP+ or EGFP-MYCN+ cells co-expressing phox2bb (C) or dbh (G) in 3 dpf larvae. For phox2bb EGFP n = 8, EGFP-MYCN n = 11; for dbh EGFP n = 4, EGFP-MYCN n = 4. D,H) Mean phox2bb (D) or dbh (H) fluorescence intensity quantified in the SCG and normalized to dbh:EGFP average intensity at 3 dpf. For phox2bb EGFP n = 8, EGFP-MYCN n = 12; for dbh EGFP n = 8, EGFP-MYCN n = 12. Markers: EGFP (green), phox2bb or dbh (cyan) and coloc channel (yellow). A (anterior), P (posterior), D (dorsal), V (ventral) axes shown in upper left corner. Scale bars = 10 μm. I) Violin plot showing phox2bb expression from single cell datasets of sox10 derived cells at 24, 48, and 69 hpf. J,K) Representative images of SCG from dbh:EGFP (J) and dbh:EGFP-MYCN (K) larvae after immunofluorescence against Phox2b and EGFP at 3 dpf. L) Mean Phox2b fluorescence intensity quantified in the SCG and normalized to dbh:EGFP average intensity at 3 dpf. Markers: EGFP (green), Phox2b (pink). Scale bars = 7 μm. For all graphs n.s., non-significant (P>0.05).
|