
Fig. 1
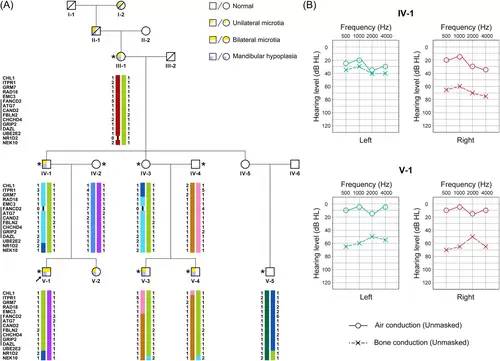
Clinical presentation of the Goldenhar syndrome pedigree. (A) Diagram of the five-generation pedigree and linkage analysis. The most likely haplotypes were calculated via haplotype analysis with collapsed haplotype pattern markers. The significant linkage region between FANCD2 and DAZL on chromosome 3 is shown via the black line. Females are shown with circles and males with squares. Text below the symbols show the ID of each family member. Asterisks show individuals having received whole-exome sequencing. The proband (individual V-1) is marked with a black arrow. (B) Pure-tone audiometry assessment result of family members IV-1 and V-1 |