
Fig. 4
- ID
- ZDB-FIG-240703-52
- Publication
- Chouhan et al., 2024 - Cell-size-dependent regulation of Ezrin dictates epithelial resilience to stretch by countering myosin-II-mediated contractility
- Other Figures
- All Figure Page
- Back to All Figure Page
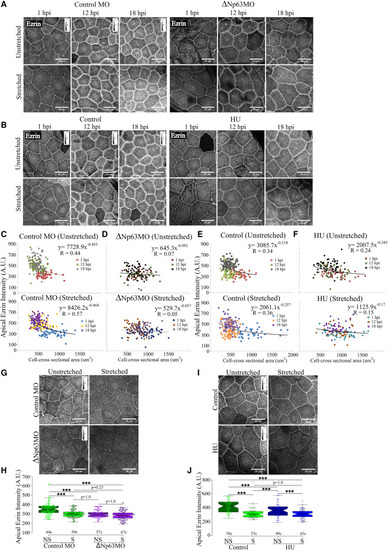
Cell size perturbation affects apical Ezrin levels (A–F) Confocal micrographs (A and B) and scatterplots (C–F) showing apical localization of Ezrin and fluorescence intensity (a.u.) at 1, 12, and 18 hpi in ΔNp63 morphants (A, C, and D) and HU-treated embryos (B, E, and F). Scatterplots show an inverse relationship between cell cross-sectional area (μm2) and apical Ezrin intensity (a.u.) in the controls (C and E), and the trend alters and the correlation (R value) deteriorates upon both ΔNp63 knockdown (D) and HU treatment (F). (G–J) Confocal micrographs (G and I) and boxplots (H and J) show changes in apical Ezrin fluorescence intensity (a.u.) immediately post-stretch (0 hpi, 24 hpf) in ΔNp63 morphants (G and H) and HU-treated embryos (I and J). Scale bar: 25 μm. Calibration bars: 0–1,850 a.u. (A), 0–1,250 a.u. (B), and 0–1,023 a.u. (G and I). hpf, hours post-fertilization; hpi, hours post-injection; NS, no stretch; S, stretched; c, cells; e, embryos. ∗p < 0.05, ∗∗p < 0.01, and ∗∗∗p < 0.001 by Kruskal-Wallis test with Dunn’s post hoc test. |