
Fig. 1
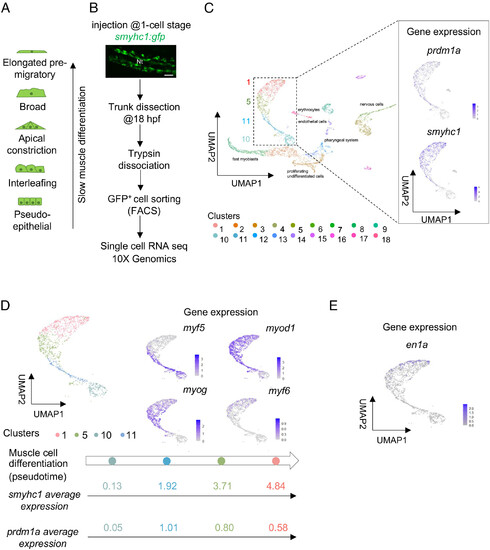
Differentiating SMPs display specific gene expression signatures. (A) Schematics of the morphological series of differentiating SMPs in 18 hpf embryos. (B) Schematic representation of the protocol used for scRNAseq; Confocal projection of smyhc1:gfp expression in a living 18 hpf embryo. Dorsal view. (Scale bar, 50 µm.) Nt, notochord. Anterior is left. (C) UMAP plot obtained after mapping on the zebrafish genome and clusterization of isolated GFP+ cells (Left panel); UMAP feature plots showing expression patterns of slow muscle lineage markers prdm1a and smyhc1 (Right panel). (D) UMAP plot obtained after isolation of the clusters corresponding to SMP lineage; UMAP feature plots showing the expression pattern of myogenic regulatory factors in differentiating SMPs (Right panel); pseudotime trajectory of differentiating SMPs; smyhc1 and prdm1a average expression in each cluster (Bottom panel). Colors represent different clusters. (E) UMAP feature plot showing the expression of the MP marker en1a. |