
Fig. 8
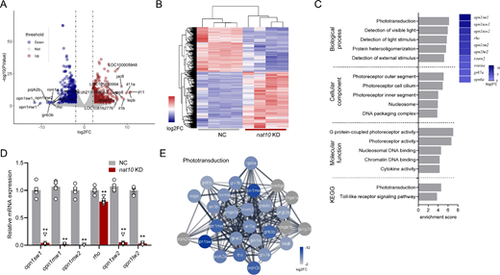
Transcriptomic profiling of nat10 KD in zebrafish larvae. (A) Volcano plots illustrate the differential gene expression between the NC and the nat10 KD zebrafish larvae. Differentially expressed genes, indicated by P < 0.05 and a log2 fold change (log2FC) ≥2 (downregulated genes in blue, upregulated genes in red, and nonsignificant changes in gray). (B) A hierarchical heatmap shows the differential expression patterns in 4 independent NC and nat10 KD samples, with color intensity indicating fold changes; upregulation and downregulation are marked in red and blue, respectively. (C) Gene Ontology (GO) enrichment analysis for genes differentially expressed in nat10 KD larvae, showing the top 5 GO terms in four categories ranked by enrichment score. The right panel shows a heatmap of genes associated with the phototransduction GO term, with a color scale reflecting log2FC. (D) Quantitative real-time RT-PCR validation of mRNA levels for key differentially expressed genes in phototransduction. Results are presented as mean ± SEM from six independent experiments. Statistical analysis was performed using 1-way ANOVA with the Tukey post hoc test; ***P < 0.001 vs. NC. (E) Construction of a protein-protein interaction network for the phototransduction interactome using STRING database. |