
Fig. 1
- ID
- ZDB-FIG-240126-26
- Publication
- Takesono et al., 2023 - Zinc oxide nanoparticles disrupt development and function of the olfactory sensory system impairing olfaction-mediated behaviour in zebrafish
- Other Figures
- All Figure Page
- Back to All Figure Page
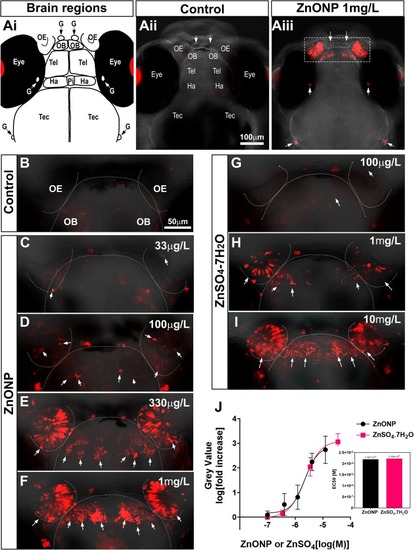
ZnONP exposure specifically induces OS responses in the OE and OB. (Ai) Forebrain -and Midbrain regions in 4 dpf zebrafish embryo-larvae. OE, olfactory epithelium; OB, olfactory bulb; Tel, telencephalon; Ha, habenula; Pi, pineal; Tec, tectum; G, ganglions; Eye. (Aii-iii) Confocal image of control (Aii) and ZnONP (1 mg/L) exposed (Aiii) EpRE:mCherry embryo-larvae. The dotted white square in Aiii, OS responses in the OE and OB; OS responses in ganglions, white arrows. (B-I) ZnONP and dissolved Zn induce a concentration-dependent OS responses in the olfactory tissues. Control (B); ZnONP 33 μg/L (C), 100 μg/L (D), 330 μg/L (E), 1 mg/L (F); ZnSO4·7H2O, 100 μg/L (G), 1 mg/L (H) and 10 mg/L (I). OS responding cells, white arrows; the outlines of the OE and OB, white dotted lines. Scale bar, 50 μm. (J) The dose–response curves of ZnONP (black) and ZnSO4·7H2O (pink) were similar when the molar concentrations were compared. The mean grey values (fluorescent intensity) ± SEM are shown as log [fold increase of grey value] in the OE. EC50 values are shown in the inset bar graph. Non-linear curve fitting was applied to calculate EC50 values using GraphPad Prizm version 9.3.1. Data were derived from five independent experiments for ZnONPs and two independent experiments for ZnSO4·7H2O, with 8 replicates for each condition per experiment. (For interpretation of the references to colour in this figure legend, the reader is referred to the web version of this article.) |