
Fig. 4
- ID
- ZDB-FIG-240112-71
- Publication
- Hutto et al., 2023 - Cone photoreceptors transfer damaged mitochondria to Müller glia
- Other Figures
- All Figure Page
- Back to All Figure Page
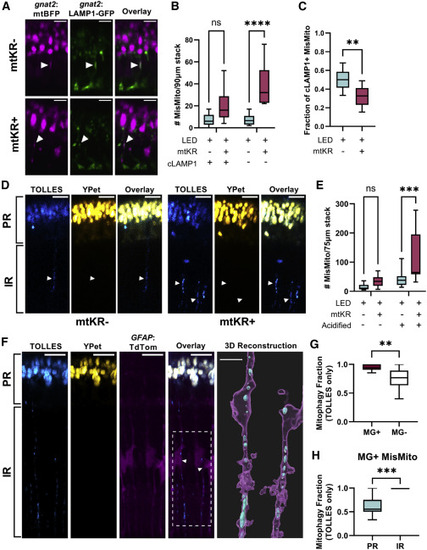
Cone mitochondria degradation occurs in MGs (A) In vivo imaging of Tg(gnat2:mtBFP, gnat2:LAMP1-GFP) fish; mislocalized mitochondria colocalized with cone lysosomes (filled arrows) in mtKR− and mtKR+ fish. Scale: 5 μm. (B) Quantification of (A) shows a marked increase in mislocalized mitochondria unassociated with cone lysosomes upon ROS stress. cLAMP1, cone LAMP1. n = ∗∗∗∗p < 0.0001 using a two-way ANOVA. n = 10 fish each condition. (C) Fraction of cLAMP1+ mislocalized mitochondria from data in (A) and (B). While mtKR have more mislocalized mitochondria, a lower fraction is associated with cone lysosomes compared with controls. n = 10 mtKR+ fish, n = 9 mtKR− fish (1 excluded from fraction due to <5 total mislocalized mitochondria). ∗∗p < 0.01 using Welch’s t test. (D) In vivo imaging of Tg(gnat2:mtSRAI) with and without mtKR (LED treated). PR, photoreceptor layer; IR, inner retina. Mitochondria that have lost YPet fluorescence (acid and protease sensitive) are in acidified compartments. Arrowheads indicate “trails” of acidified cone mitochondria in the IR. Scale: 10 μm. (E) Quantification of acidified mislocalized mitochondria from dataset in (D). 3D volumes were generated in Imaris, manually binned as mislocalized/ellipsoidal, and identified as acidified if mean fluorescence TOLLES > Ypet. noKR n = 12; KR+ n = 9 fish. ∗∗∗p < 0.001 with two-way ANOVA. (F) In vivo imaging of normal, unstressed Tg(gnat2:mtSRAI, GFAP:TdTomato) fish (no mtKR, no LED). Trails of TOLLES+ mislocalized cone mitochondria colocalize with MG processes in the IR. Scale: 10 μm. Imaris was used to generate a 3D reconstruction (scale: 5 μm) of two of these MGs; their cell bodies are noted by an arrowhead and the ROI by a dotted line in the overlay fluorescent image (magenta: MG, cyan: TOLLES+ MisMito). (G) Mitophagy fraction (acidified/total) of mislocalized mitochondria inside and outside MGs in unstressed fish. Mitochondria were manually binned by presence of YPet (see STAR Methods). n = 11 fish. ∗∗p < 0.01 with Welch’s t test. (H) Mitophagy fraction (acidified/total) of cone mitochondria in MG, binned by location in the retina. Mitochondria observed in inner retinal portions of MG were acidified. n = 11 fish. ∗∗∗p < 0.001 with Welch’s t test. |