
Fig. 4
- ID
- ZDB-FIG-231215-68
- Publication
- Pestel et al., 2016 - Real-time 3D visualization of cellular rearrangements during cardiac valve formation
- Other Figures
- All Figure Page
- Back to All Figure Page
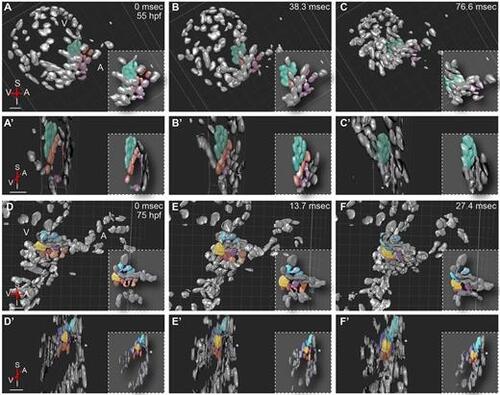
4D analyses of beating hearts show that cells located at the abluminal side of the immature valve contribute to a more efficient closure of the AVC. 3D volume rendering of a Tg(kdrl:nls-EGFP) heart in different contraction stages in sagittal (A-F) and transverse (A′-F′) projections. Unsynchronized z-stacks of a beating heart were taken at 55 and 75 hpf. The images were post-acquisitionally aligned. For a better understanding of the cell movements during cardiac contraction, a subset of cells was false colored. At 55 hpf, cells at the atrial side of the AVC (purple and red) form a ring that progressively constricts to achieve the closure of the AVC (A′,B′). During ventricular systole, cells lining the ventricular side of the AVC (false colored in green) also support the closure of the AVC. At 75 hpf, the closure of the AVC starts with the downward movement of a subset of cells at the atrial side of the AVC (brown and red). These cells touch the opposite side of the AVC (E,E′), and their downward movement transforms into a sideward movement (arrows), which brings additional cells in contact with each other (F,F′). Note that for a better view of the valve leaflets, ventral cells covering the AVC were removed in D-F, but can be seen in D′-F′ (asterisk). Cells on the abluminal side are false colored in blue (D-F′). Insets show cartoons of the AVC. A, atrium; I, inferior AVC; S, superior AVC; V, ventricle. Scale bars: 40 µm. |