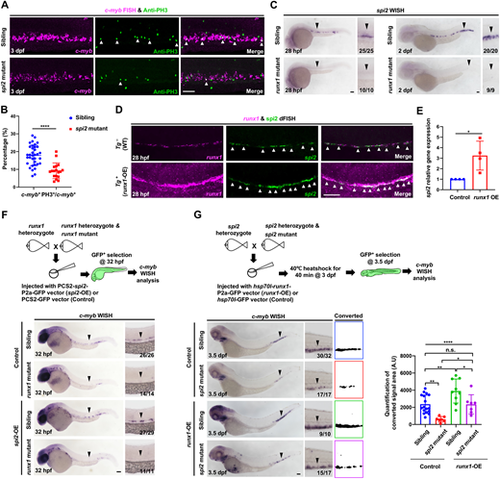
spi2 acts downstream of runx1 and regulates HSPC proliferation in the CHT. (A) Images of c-myb FISH (magenta) and anti-PH3 staining (green) in the caudal hematopoietic tissue (CHT) in spi2 mutants and siblings at 3 dpf. White arrowheads show c-myb+PH3+ cells. (B) The percentage of c-myb+PH3+ cells in the CHT in spi2 mutants (n=18) and siblings (n=35) at 3 dpf in A. (C) WISH of spi2 in the aorta-gonad-mesonephros (AGM) and CHT in runx1W84X mutants and siblings at 28 hpf and 2 dpf. Black arrowheads show spi2-expressing cells. (D) dFISH of runx1 (magenta) and spi2 (green) in the AGM of WT (Tg−) and runx1-overexpressed Tg(flk1:runx1-P2a-GFP) embryos (Tg+: runx1-OE) at 28 hpf. White arrowheads show runx1+spi2+ cells. (E) qPCR analysis of spi2 expression in runx1-OE and control endothelial cells (ECs). runx1-OE, ECs with runx1 overexpression; Control, ECs without runx1 overexpression. (F) c-myb WISH in 32 hpf runx1 mutants and siblings with or without spi2 overexpression. PCS2-spi2-P2a-GFP (spi2-OE) or PCS2-GFP (control) vector was injected into one-cell stage embryos. Black arrowheads show c-myb-expressing cells. (G) c-myb WISH and quantification of c-myb signals in the CHT in spi2 mutants and siblings with (siblings n=17; mutants n=7) or without (siblings n=9; mutants n=7) runx1 overexpression. hsp70l-runx1-P2a-GFP (runx1-OE) or hsp70l-GFP (control) vector was injected into one-cell stage embryos. Heat shock was performed at 3 dpf at 40°C for 40 min. Black arrowheads show c-myb-expressing cells. Data are mean±s.d. n.s., P>0.05; *P≤0.05; **P≤0.01; ****P≤0.0001. (An unpaired Student's t-test was used in B and E. Two-way analysis of variance (ANOVA), followed by Tukey's multiple comparisons tests were used in G.) Scale bars: 60 μm.
|
