
Fig. 3
- ID
- ZDB-FIG-231215-151
- Publication
- Demy et al., 2022 - Trim33 conditions the lifespan of primitive macrophages and onset of definitive macrophage production
- Other Figures
- All Figure Page
- Back to All Figure Page
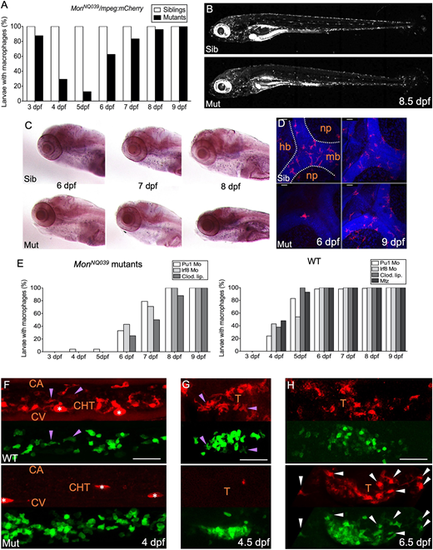
The production of macrophages from definitive hematopoiesis is delayed in moonshine mutants. (A) In vivo quantification of the percentage of sibling and monNQ039 mutant larvae with macrophages from 3 to 9 dpf, using a Tg(mpeg1:mCherry-F) background; n=84 sibling and 24 mutant larvae. (B) mCherry+ macrophages in live 8.5 dpf Tg(mfap4:mCherry-F) control sibling (top) and monTB222 mutant (bottom) larvae; maximum projection. (C) In situ hybridization for whole-mount detection of Csfr1a-expressing cells in control siblings (top) and monNQ039 mutants (bottom) at 6, 7 and 8 dpf. (D) Fluorescent immunodetection of L-plastin+ (leucocytes, red channel) macrophages in the brain of control siblings (top) and monNQ039 mutants (bottom) at 6 (left panels) and 9 (right panels) dpf; maximum projection, dorsal view. Nuclei are stained with Hoechst (blue channel). (E) In vivo quantification from 3 dpf to 9 dpf of the percentage of monNQ039 mutants (left graph) or wild-type controls (right graph) with mCherry+ macrophages under different experimental conditions aimed at removing primitive macrophages: injection of Pu1 MO, Irf8 MO or clodronate liposomes (Clod. Lip.), and metronidazole (Mtz)-mediated ablation in the Tg(mpeg1:Gal4;UAS:NfsB-mCherry) line; n=21 mutant and 88 wild-type larvae. (F-H) Lateral view of the (F) tail region or (G,H) thymus region of wild-type control (top) and mon mutants (bottom) expressing gata2b:Gal4;UAS:LifeAct-eGFP (hemogenic/HSPC-derived cells, green channel) and mpeg1:mCherry-F (macrophages, red channel) transgenes at 4 dpf (F), 4.5 dpf (G) and 6.5 dpf (H); maximum projection. Arrowheads indicate double-positive macrophages in controls (purple) and mutants (white); asterisks indicate pigment cells. Sib, sibling; Mut, mutant; hb, hindbrain; mb, midbrain; np, neuropil; CA, caudal artery; CHT, caudal hematopoietic tissue; CV, caudal vein; T, thymus. Scale bars: 50 µm. |