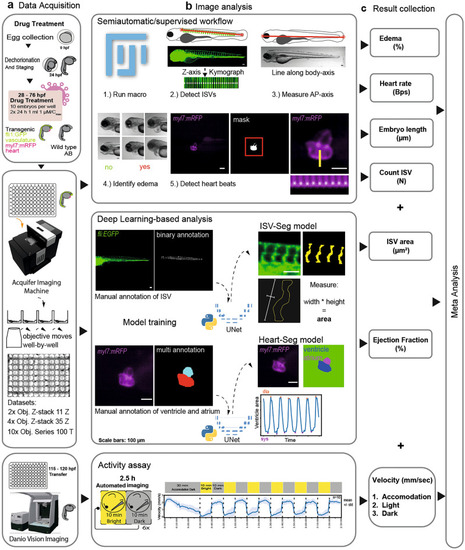
Schematic representation of the experimental workflow. (a) Tg(fli1:EGFP);(myl7:mRFP) embryos were used for the morphological assay (green: cytoplasmic GFP in endothelium; magenta: membrane RFP in cardiomyocytes). After drug treatment, between 96 and 104 hpf, the anesthetized larvae were transferred to 96 well plates with pre-formed agarose beds by a 3D printed mold. This is followed by image acquisition. Treated larvae positioned in a 96 well plate are imaged using a Smart Imaging Wide field Fluorescent Microscope Platform. (b) Image analysis. (1) Image analysis through a semiautomatic and blinded workflow based on a Fiji-macro. (2) To count the intersegmental vessels (ISV) the user draws a line (red line) along all ISVs. A kymograph along the Z-axis allows detection of local maxima. (3) The larval length from anterior to posterior (AP) is measured by drawing a line from the most anterior of the head to the most posterior of the tail. (4) Effusions are identified as shown in the examples. (5) For heartbeat measurements, hearts are detected with an automated threshold to generate a mask and a kymograph along the time axis detects the local maxima. For the deep learning-based analysis, image data of the ISV and the heart are manually annotated. The annotated data are used to train two different U-Net models. The ISV-Seg model is applied to segment each ISV and calculate the area. The Heart-Seg model is used to segment ventricle and atrium. The minima and maxima of the ventricular area along the time axis are used to calculate the ejection fraction. For the behavioral assay, wild type larvae were treated with the drugs and transferred to 96 well plates. The swimming of larvae with a defined light–dark exposure was recorded and the tracking data exported. (c) The results are collected and used for meta-analysis with Python. The results were presented as heat maps and in a customized online Streamlit data app.
|
