
FIGURE
Fig. 4
- ID
- ZDB-FIG-231003-19
- Publication
- Bradshaw et al., 2023 - Zebrafish as a model for cardiac disease; Cryo-EM structure of native cardiac thin filaments from Danio Rerio
- Other Figures
- All Figure Page
- Back to All Figure Page
Fig. 4
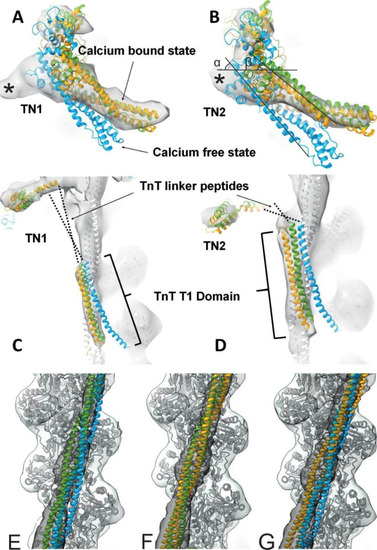
Conformation of troponin core domain and tropomyosin positions. The high and low Ca2+ models 6KN8 (green) and 6KN7 (blue) were docked into our thin filament reconstruction and compared to our zebrafish model (yellow). |
Expression Data
Expression Detail
Antibody Labeling
Phenotype Data
Phenotype Detail
Acknowledgments
This image is the copyrighted work of the attributed author or publisher, and
ZFIN has permission only to display this image to its users.
Additional permissions should be obtained from the applicable author or publisher of the image.
Full text @ J. Muscle Res. Cell Motil.