FIGURE

Figure 5

ID
ZDB-FIG-231002-315
Publication
Pietrobon et al., 2023 - Tissue-Engineered Disease Modeling of Lymphangioleiomyomatosis Exposes a Therapeutic Vulnerability to HDAC Inhibition
Other Figures
All Figure Page
Back to All Figure Page
Figure 5

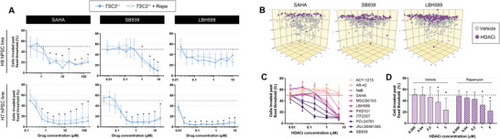
HDAC inhibitors attenuate cell invasion independent of cytotoxicity. A) Live TSC2−/− cells (H9 top panels, H7 bottom panels) invaded past fixed threshold set by median invasion distance of vehicle control, upon 3 day HDAC inhibitor treatment ± 20 × 10−9m rapamycin (mean ± SD; * = p < 0.05 by two‐way ANOVA with Dunnett post hoc comparison to untreated; n = 3). B) Computational reconstruction of live cell spatial positions upon 3 day hydrogel culture of TSC2−/− cells ± HDAC inhibitor (HDACi) treatment (20 × 10−6m SAHA, 5 × 10−6m SB939, 1 × 10−6m LBH589). Note that treated and untreated cells were in separate wells; cells were plotted in the same volume for ease of visualizing relative distances traveled. C) Effect of 11 HDAC inhibitors on TSC2−/− live cell invasion ± 20 × 10−9m rapamycin. Fixed threshold set by median invasion distance of vehicle control. D) Aggregated effect of the 11 HDAC inhibitors presented in panel (C) (mean ± SD; * = p < 0.05 by two‐way ANOVA with Dunnett post hoc comparison to untreated for each group; n = 33 via 11 HDACi, n = 3 each).

Expression Data

Expression Detail
Antibody Labeling
Phenotype Data

Phenotype Detail
Acknowledgments
This image is the copyrighted work of the attributed author or publisher, and ZFIN has permission only to display this image to its users. Additional permissions should be obtained from the applicable author or publisher of the image. Full text @ Adv Sci (Weinh)