Figure 1—figure supplement 2.

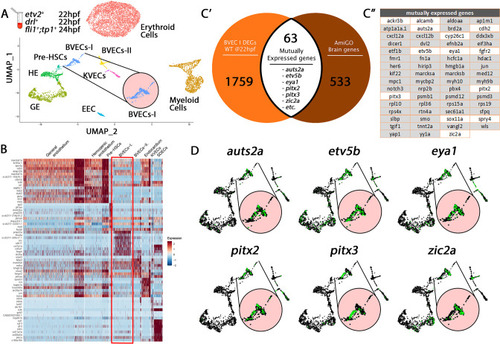
Comparison of BVECs-I cluster genes to brain annotated genes validates cluster origin.

(A) Uniform manifold approximation projection (UMAP) plots of scRNA-seq data of total endothelial lineage cells collected from TgBAC(etv2:Kaede)ci6, Tg(fli1:DsRed)um13; Tg(tp1:GFP)um14, and Tg(drl:H2B-dendra) embryos at 22–24 hpf. Clusters were named according to their gene expression: Erythroid, Lymphoid, General Endothelium (GE), Hemogenic Endothelium (HE), Pre-HSCs, Brain Vascular Endothelial Cells (BVECs-I and BVECs-II), Kidney Vascular Endothelial cells (KVECs), Endocardial Endothelial Cells (EECs), and somite-derived endothelial cells (SDECs). Color-coded marker gene expression levels are shown on corresponding clusters. A pink circle highlights the BVECs-I cluster. (B) Expression heatmap of 22–24 hpf single-cell transcriptome showing the top predicted differentially expressed marker genes across the different clusters. A red box highlights the BVECs-I cluster. (C’,C”) A list of brain-annotated genes was curated from the AmiGo annotation database and compared with the BVECs-I transcriptome. 63 genes were commonly expressed. Interestingly, several of these 63 genes were enriched within the BVECs-I cluster (C”; white boxed genes, D; enlarged circles).

Expression Data

Expression Detail
Antibody Labeling
Phenotype Data

Phenotype Detail
Acknowledgments
This image is the copyrighted work of the attributed author or publisher, and ZFIN has permission only to display this image to its users. Additional permissions should be obtained from the applicable author or publisher of the image. Full text @ Elife