
FIGURE
Fig. 1
- ID
- ZDB-FIG-230915-14
- Publication
- Gehlen et al., 2022 - Elucidation of the genetic causes of bicuspid aortic valve disease
- Other Figures
- All Figure Page
- Back to All Figure Page
Fig. 1
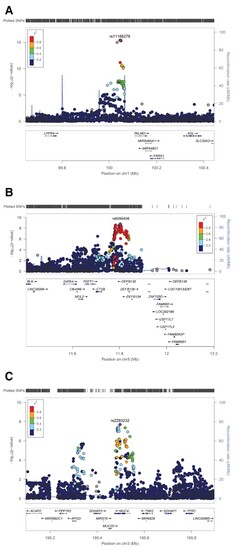
Regional association plots of BAV risk loci on chromosome 1p21 near PALMD (A), 8p23 near GATA4 (B) and 3q29 within MUC4 (C). At each locus, associations [−log10(P-values)] are shown for SNPs flanking 400 kb on either side of the lead associated SNP. The lead variant is indicated by the corresponding rs-number. Other markers at each locus are displayed by different colours, which indicate different levels of LD (r2) to the lead SNP. Furthermore, all annotated genes within each region are shown with arrows indicating their transcription direction. |
Expression Data
Expression Detail
Antibody Labeling
Phenotype Data
Phenotype Detail
Acknowledgments
This image is the copyrighted work of the attributed author or publisher, and
ZFIN has permission only to display this image to its users.
Additional permissions should be obtained from the applicable author or publisher of the image.
Full text @ Cardiovasc. Res.